
Table of Contents
Our attorneys exclusively represent injury victims.
For years we have fought on behalf of clients who were hurt in accidents due to the negligence of another party.
Key Takeaways
- Ridesharing services may be convenient, but there are some serious risks to passengers.
- Ridesharing companies may not be reporting all of their data, or always sharing it in easily accessible ways.
- MKP Law Group, LLP wants you to know the truth about rideshare safety so you can make informed decisions.
We all feel like ridesharing is a safer option and easier option (thanks to easy access from services like Lyft and Uber apps), but do we ever stop to wonder how often rideshare drivers get into accidents?
The ride-hailing market is a convenience for the passenger, but this alternative to traditional taxi services comes with its own host of issues, particularly for those who find themselves involved in a rideshare accident.
Considering that Uber drivers, Lyft drivers, and other rideshare drivers are independent contractors, is there any way to keep track of rideshare accident facts?
Unfortunately, much of the detailed information is hard to find. We’ve collected a range of rideshare accident statistics to better understand the risk of motor vehicle accidents that occur when using rideshare services.
Here’s what you need to know about rideshare industry statistics, particularly Uber and Lyft accident statistics.
Top Lyft and Uber and Other Ridesharing Market Accident Statistics
It is unclear how – and if – first responders keep track of accidents that involve Lyft and Uber drivers (or other rideshare drivers) and passengers. Therefore, the Booth School of Business at the University of Chicago developed a model that compares and contrasts car crashes with the rollout of rideshare companies between 2001 and 2016.
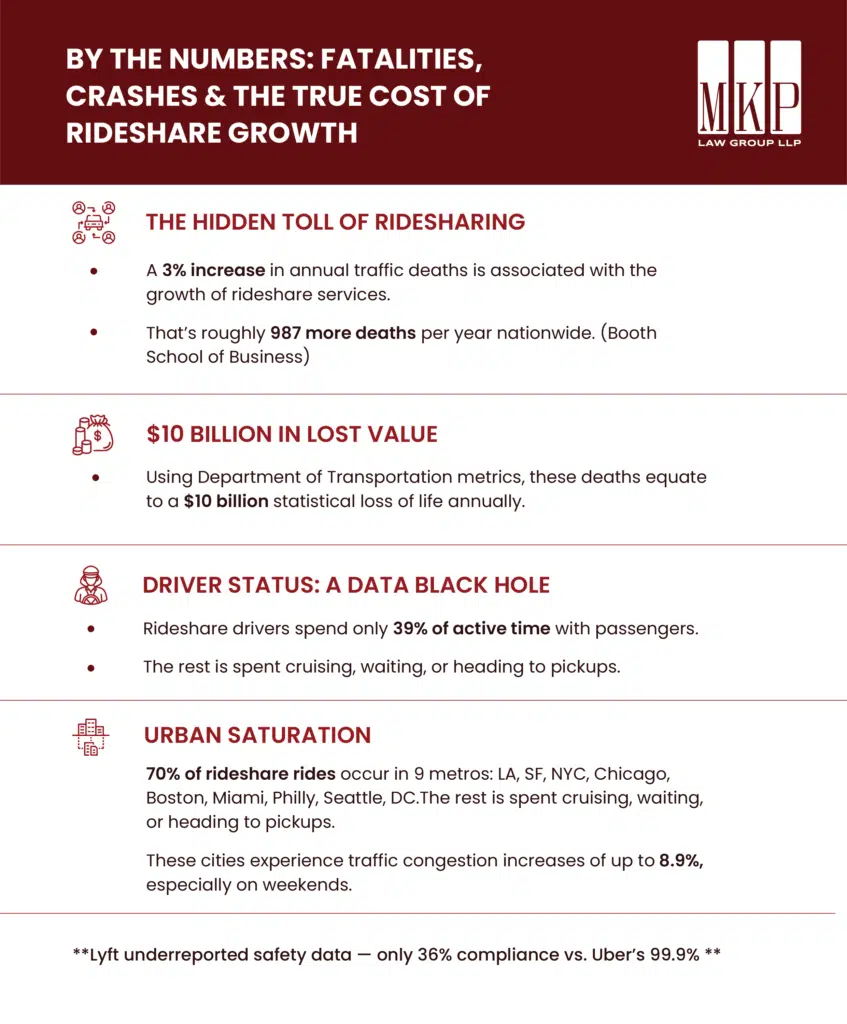
3% Increase in Vehicle Accident Deaths
By comparing the increase in vehicle accidents in recent years for collisions and adjusting for the fact that more cars are on the road, the experts found that rideshare services could have contributed to an increase of 3% in annual deaths associated with cars. (Booth School of Business)
The calculations suggest that this involves 987 people each year.
$10 Billion Loss of Statistical Life
The Department of Transportation calculates how many years of life are lost due to car accidents. It then translates this number into what these Americans could have earned. For individuals involved in deadly accidents with the ride-hailing industry, the possible traffic fatalities reached a $10 billion figure. (Booth School of Business)
Drivers Have Passengers about 39% of Their Driving Time
Reported observations indicate that rideshare drivers spend approximately 39% of their active driving time with passengers in the car and 59% of their active miles driving without passengers—whether waiting for a ride request, traveling to pick up a passenger, or repositioning themselves for future rides. (Booth School of Business)
These data points underscore the complexity of determining whether a rideshare driver was “active” or “inactive” during a vehicle accident. The distinction hinges on whether the driver was transporting a passenger, en route to pick one up, or simply waiting for a booking—all of which may be categorized differently depending on the context.
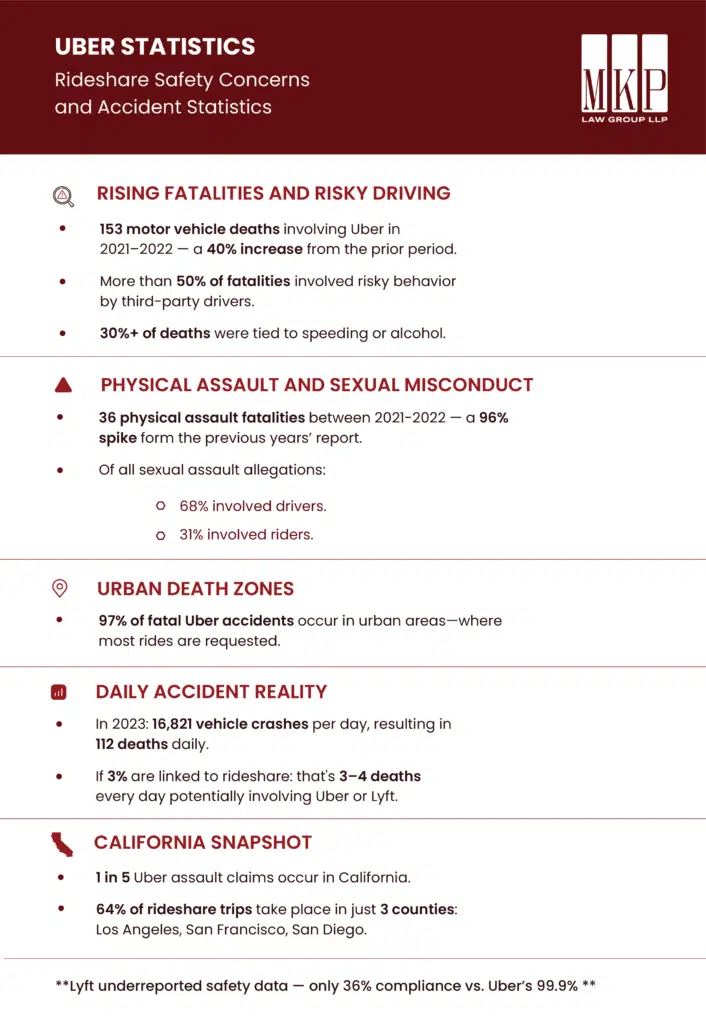
97% of Uber’s Fatal Accidents Happen in Urban Areas
The majority of Uber rideshare accidents take place in the places where most passengers will hire a rideshare driver. (Uber)
16,821 Average Daily Vehicle Crashes, 112 Deaths per Day in 2023
In 2023, there were 40,901 motor vehicle deaths, averaging about 112 fatalities every day. Additionally, the total number of vehicle crashes reached 6.14 million, translating to approximately 16,821 crashes daily. (NHTSA)
While this is not the number of rideshare accidents, these stats suggest that according to the estimated 3% increase in vehicle accident deaths from rideshare services, about 3-4 of these daily fatalities may be related to a rideshare ride. (NHTSA)
97 Fatal Crashes, 107 Deaths in a One-Year Period, According to Uber Accident Statistics
These numbers cover the 1 year period between 2017 and 2018. However, they caused an actual 107 deaths. It is important to note that traffic fatalities may involve one or more demographics. These are the rider, the driver, or the occupants of the other car.
The Increasing Risk of Rideshare Accidents
Rideshare accidents are likely to increase as the numbers of riders, drivers, and rideshare vehicle miles increase. Everything from fatal accidents to physical assaults, and property damage from Uber or Lyft accidents may soon double or triple.
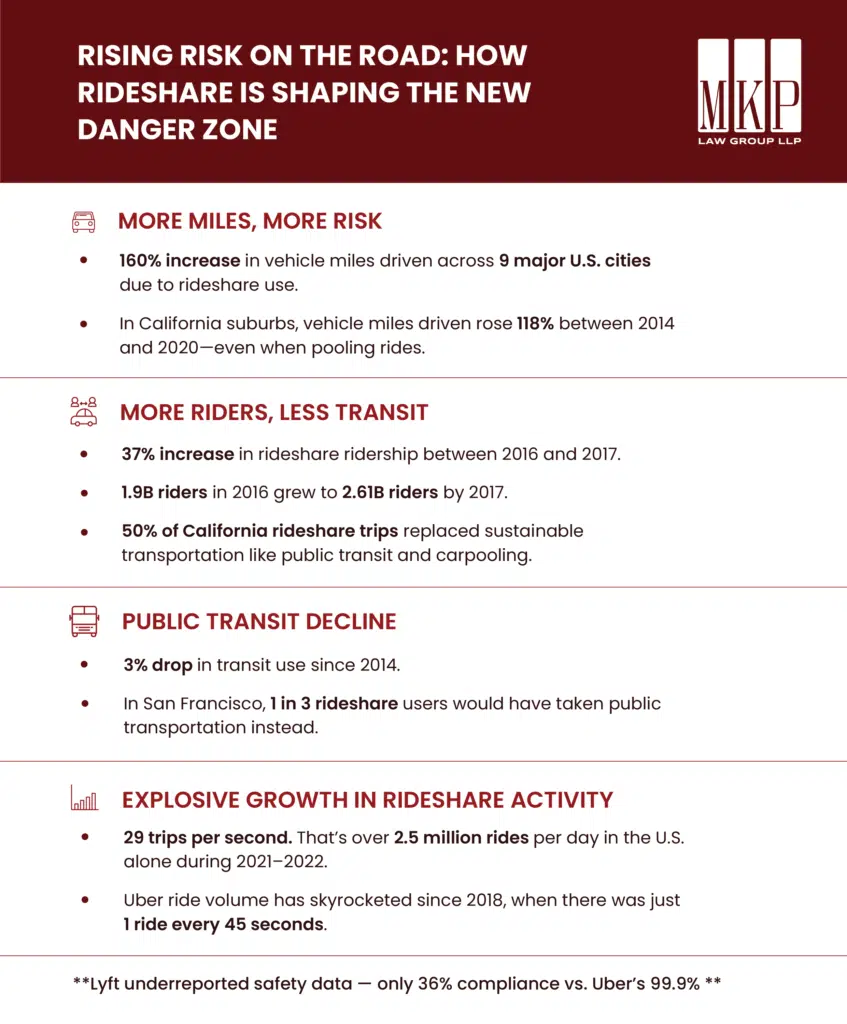
160% Increase in Vehicle Miles Driven across 9 Cities
Ridesharing services have contributed 2.6 new vehicle miles for every mile of personal driving they replace.
That’s a 160% increase in traffic on city streets across the nine large, densely populated metropolitan areas noted above (New York, Los Angeles, Chicago, Boston, San Francisco, Miami, Philadelphia, Seattle, and Washington D.C.). (Shaller)
118% Increase in Vehicle Miles Traveled in California Suburbs from 2014 to 2020
From 2014 to 2020, there were major increases in vehicle miles traveled, even when accounting for ride-hail pooling, that is, when passengers opted for shared rideshare services. (Shaller)
70% of Rides are in 9 Metropolitan Areas
Los Angeles, San Francisco, Boston, Chicago, Miami, New York, Philadelphia, Seattle and Washington DC. are the most popular metropolitan areas for rideshare drivers. In these major urban areas, Uber and Lyft drivers often help residents get to and from work, transport them to leisure activities, and handle short-distance trips such as taking a customer from a car mechanic to their home. (Shaller)
37% Increase in Ridership
Schaller outlines a 37% year over year increase in rideshare riders from 2016 to 2017. In numbers, this means that there were 1.9 billion passengers in 2016, compared to 2.61 billion a year later.
50% of California Rideshare Trips Replace Sustainable Forms of Transport
Analyzing data from 3 major California metropolitan regions from 2018-2019 found that over 50% of Uber and Lyft rides replace more sustainable transportation such as public transit, carpooling, and more. (Giller, J., Young, M., & Circella, G. (2024))
3% Decline in Public Transit Riders
An article drafted by the University of California at Davis supports the notion that fewer passengers opt for public transportation. They noted a 3% decline since 2014. For example, in San Francisco, one-third of rideshare users select this mode of transportation instead of public transit.
Traffic Congestion Increases up to 8.9%
Since the first ridesharing vehicles hit the roads in 2009, “congestion increased by almost 1 percent while the duration of congestion rose by 4.5 percent.” (MIT) However, that congestion may depend on the day of the week and your location.
For example, cities with good public transportation saw increases of up to 8.45% (weekdays) and 8.84% (weekends). (Penn State)
1/3 of Americans Use Rideshare Services as of 2018
From 2015 to 2018 the proportion of Americans who had used rideshare services more than doubled from 15% to 36%. (PEW Research Center)
Uber Statistics — Rideshare Safety Concerns and Accident Statistics
Uber Technologies is notoriously close-mouthed about its accident statistics. Fortunately, the company began releasing safety reports for their ride-hailing services starting with data from 2017 to 2018. All the following stats are sourced from their latest 2021-2022 Uber report.
29 Uber Trips per Second in 2021-2022
That amounts to over 2.5 million U.S. trips per day, the average for 2021 and 2022. That’s a lot more than the average 1 ride every 45 seconds in 2018.
153 motor vehicle fatalities, +40%
Uber-related motor vehicle accident fatalities increased since the prior period by 40%, from 101 in 2019 to 2020 to 153 in 2021-2022.
More than half of these Uber-related fatalities involved risky driving behavior, predominantly attributed to third-party drivers.
Over 30% of Uber-Related Fatalities Involve Speeding or Alcohol Impairment.
Over 30% of total Uber-related accident fatalities were caused by either speeding or alcohol impairment, such as drunk driving.
+96% Increase in Physical Assault Fatalities.
36 physical physical assault fatalities in 2021-2022, a huge increase compared to the previous Safety Report.
68% of Drivers Were Accused of Sexual Assault.
31% of Riders were the accused individual. These assaults include 5 categories, non-consensual touching of a sexual body part was the most frequent with 1,401 reported incidents.
1.2% Support Requests.
These support requests cover everything from lost items and cleaning fees to refund disagreements. In some cases, they also give feedback.
0.1% of Support Requests Noted Safety Issues.
Uber customers reported incidents of “harsh braking” or arguments as being safety issues.
Uber and Lyft in California: More Rideshare Statistics
The SF Public Press faults the PUC for failing to disclose raw data by citing footnote 42. This means that the data currently available is carefully curated.
Taking Uber at its word would mean that the company has a very small percentage of problems. However, data from the California Public Utilities Commission (CPUC) highlights some interesting statistics. Here are some additional stats that provide more insights about Uber and Lyft operations in California.
1 in 5 Uber Incidents of Claimed Sexual Assault Occurred in California
1,243 of 5,981 of the Uber assault claims detailed in the 2017-2018 Safety Report, or 21% of the cases cited, took place in the Golden State as opposed to another location. (CPUC)
Lyft only reports 36% of the required data, Uber reports 99.9%
CPUC has set standards that are largely incomplete, with Lyft only reporting 36% of the required data and Uber reporting much more, 99.9%.
Additionally, both companies have submitted data that is inconsistent across their internal reports, by as much as 81%. (TNC Report)
30 Times More Assaults and Harassments Reported by Lyft vs. Uber, 3 Times More Public Safety Incidents
Per 100,000 trips, Lyft reports many more public safety incidents than Uber. This suggests that these companies may be measuring their safety incidents differently, and points to the need for regulators to standardize the reporting for these companies. (Transportation Network Company – TNC 2020 Report)
64% of all Rideshare Trips in California are in 3 Counties
Almost two-thirds (64%) of all rideshare trips in California were in only 3 counties: Los Angeles,
San Francisco, and San Diego. Los Angeles has the most trips of any county, San Francisco has the greatest concentration of trips per square mile. (TNC Report)
$3.8 Million in Fines to LAX
One example of data not readily available is the $3.8 million figure uncovered by Vice, which referred to fines Uber drivers had to pay to LAX.
Rideshare at Large
US Rideshare Dominates, Defying Global Taxi Trends
While most countries like South Korea, China, the UK and Germany still prefer taxis over ridesharing, the U.S. stands out. The survey also found that 82% of Americans never use taxis, while 29% (occasionally + frequently) use rideshare services like Uber or Lyft. (Statista)
26% of Americans Use Uber Annually
In the United States and the United Kingdom, about 25% of people reported using Uber in the past 12 months. The app is even more popular in Australia (33%), but adoption lags in parts of Europe, with just 7% of Italians and 5% of Germans using the service. (Statista)
Rideshare Civil Suits Stats and Facts
Another caveat to consider is that rideshare companies pay out in civil suits. However, due to the nature of the settlements, the figures or the actions leading to the suits are not being disclosed. Therefore, it is difficult to assess what the true Uber, Lyft, and overall rideshare accident rates might be.
Here’s what we can tell you.
Settlements can range from $25,000 to $1 million
Estimates for personal injury rideshare settlements range wildly, from as low as $25,000 to as much as $300,000 and up to $1 million.
There are 3 Rideshare Periods
Rideshare insurance companies have defined 3 specific periods to inform insurance coverage minimums.
| Rideshare Period | Stage Description | Insurance Coverage |
| n/a | App is Off | Driver’s personal auto insurance applies |
| 1 | App is On (Waiting for a Ride) | Third-party liability coverage from rideshare company with minimum coverage amounts |
| 2 | En Route to Pick Up Passenger | Rideshare company’s first and third-party coverage with higher limits |
| 3 | Passenger in the Car | Rideshare company’s first and third-party coverage with higher limits |
Rideshare accidents can be complicated, our law firm can help
Rideshare accident cases can get complicated fast, involving multiple areas of law. Whether it’s navigating deadlines, calculating a fair settlement, or negotiating with the insurance company, handling your accident case on your own can feel overwhelming.
That’s where an experienced rideshare accident attorney comes in. Our law firm specializes in these cases, ensuring your claim is filed correctly and that you receive the compensation you deserve. Whether you or a loved one has been impacted by an accident, our accident lawyers know the ins and outs of rideshare apps and how to fight back against insurers trying to save money on payouts.
Not sure if you need legal help? Take advantage of a free consultation (only 15-20 minutes) with one of our rideshare accident lawyers to explore your legal options. We are available to provide you with legal advice today, from an experienced rideshare accident attorney at our law firm — with no initial cost or fees. Reach out now to see how we can help.
We provide coverage for roadways and traffic accidents throughout Los Angeles County, Riverside County, Orange County, and San Bernardino County. No matter where your accident occurred, our team is ready to help you navigate your case and secure the compensation you deserve.