
 Trusted Content
Table of Contents
Our attorneys exclusively represent injury victims.
For years we have fought on behalf of clients who were hurt in accidents due to the negligence of another party.
Riding your bicycle is good for the planet. It is also healthy because it strengthens the heart muscle and decreases the resting pulse.
However, how safe is it?
Key Takeaways
- Cyclists are some of the most vulnerable road users.
- Wearing a helmet can significantly reduce the severity of a head or brain injury in the event of a crash.
- MKP Law Group, LLP wants cyclists to have the facts so you can make the best decisions for your safety.
Bicycle Accident Statistics
1. 1% of All Trips Take Place on Bikes
Trips involving a bicycle account for 1% of all active trips taken as of 2009. At the same time, authorities suggest that in 2015 there were 467,000 accidents involving a pedal bike. (1)
2. 5% Projected Increase in Fatalities for 2020
Although the 2020 numbers are not yet in, official estimates suggest that projected deadly bicycle accidents are up by 5%. Considering that many motorists and cyclists stayed home in 2020, this is a worrisome development. (2)
3. 1,089 Preventable Bicycle Deaths in 2019
In 2019, the number of pedal bike deaths increased to 1,089. However, nonfatal injuries declined sharply by 40%. This development suggests that rather than getting safer, it is becoming more deadly to ride a bike on today’s roads. (3)
4. 2.3% of Traffic Fatalities in 2018
In spite of the small number, fatal bike accident totals were 857 in 2018, which translates into 2.3% of all traffic deaths that year involved a bicycle. (4)
5. 47 Years of Age is the Median
Victims of cycling accidents are getting older. The average age of a bicyclist dying in a motor vehicle crash is 47. This number has increased from 41, showing that middle-aged and older drivers face the greatest danger.
This is most likely the case because children remain closer to home whereas adults ride to work or school, which takes them across many shared roads. (4)
6. Men are 7 Times More Likely to Die in a Bike Crash than Women
Fatalities of male riders, as opposed to females, are 7 times higher. When looking at injuries, men are 5 times more likely to be hurt in a crash than women. (4)
This may be because there are that many more men cycling. Across the nation, we find that there are more men on bikes than women (see here, here, here, and here).
7. Don’t Drink & Ride: 26% of Cyclists of Fatal Accidents had BAC of +0.01 g/dL
Blood alcohol content may have played a role in 26% of pedal cyclists’ death in 2018. This figure refers to pedal cyclists getting on their 2-wheeled non-motorized pedaled transport after drinking.
For reference, consider that the legal limit for adults is 0.08%. (4)
8. 37% of Accidents Involve Alcohol — Either the victim cyclist or the party at fault
Whether it is the vehicle driver or the cyclist, statistics show that alcohol was a factor in 37% of all fatal bike accident reports. The idea to ride a bike home after drinking is, therefore, not a viable option. (4)
9. 79% of Deadly Bike Accidents Happen in Urban Areas
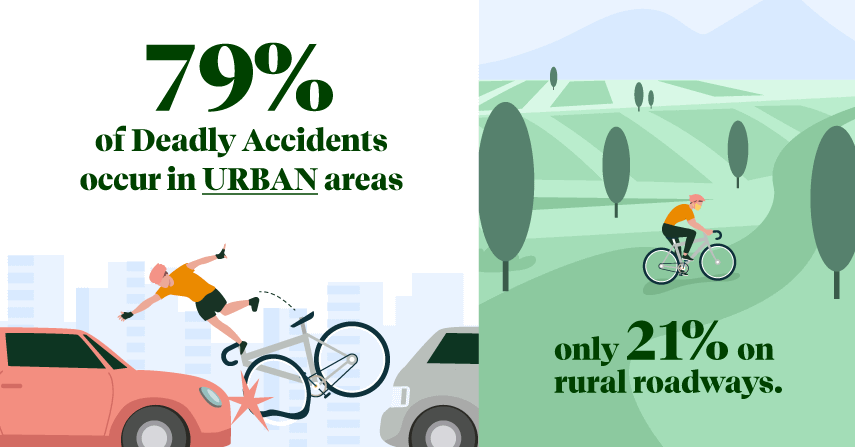
Rural areas are safer for bike riders; 21% of deadly collisions occurred there. However, far more people ride their bikes in the cities, where they are far more likely to have to share the road with cars. (4)
10. No Safe Spaces for Bike Riders
Intersections accounted for 29% of deadly accidents. Even the spaces where you thought it might be safe to ride, roadsides, medians, and bike lanes, accounted for another 11%. This leaves 60% of deadly accidents occurring in other situations. (4)
11. Danger Zone: 6 p.m. to 8:59 p.m.
Deadly accidents involving bicyclists take place at all hours of the day. However, the time between 6 p.m. and 8:59 p.m. is the most dangerous, with 19% of weekday and 23% of weekend crashes occurring. These figures may have to do with rush hour traffic and also darkness, which can make cyclists difficult to see. (4)
12. 45% of Vehicles Involved in a Deadly Bike Accident Involve Light Trucks
The most dangerous vehicle on the road, for the bicyclist, is the light truck. It is involved in 45% of deadly crashes. This makes this conveyance more dangerous than passenger cars, SUVs, and heavy trucks, which you might typically associate with bike crashes. (4)
13. 81.8% of Impacts Happened with the Vehicle’s Front
When determining the initial point of impact on the vehicle, statistics prove that in 81.8% of deadly bike accidents, the cyclist made contact with the front. The contact results in bumper injuries or those associated with an impact of the vehicle’s hood or grill.
Only 2% made initial contact with the car, truck, or van’s rear, which seems to indicate that vehicles backing up are not a primary danger. (4)
14. 4.4% of Fatalities in California
California is one of the states with the highest number of pedal cyclist fatalities, 4.4%. This puts a bike rider’s fatality rate at 3.92 per million of population.
Considering the many bike-friendly measures local officials champion, this is a sobering number. (4)
15. 6.3% Increase in Traffic Deaths
Comparing numbers of bicyclist fatalities from 2017 with 2018 shows a 6.3% increase. Rather than becoming safer, riding a bike is becoming more dangerous. As the numbers increase, so do the risks cyclists take when pedaling to work or school. (5)
16. 1.51 Times Higher Likelihood of Crashing with a Hybrid or Electric Vehicle
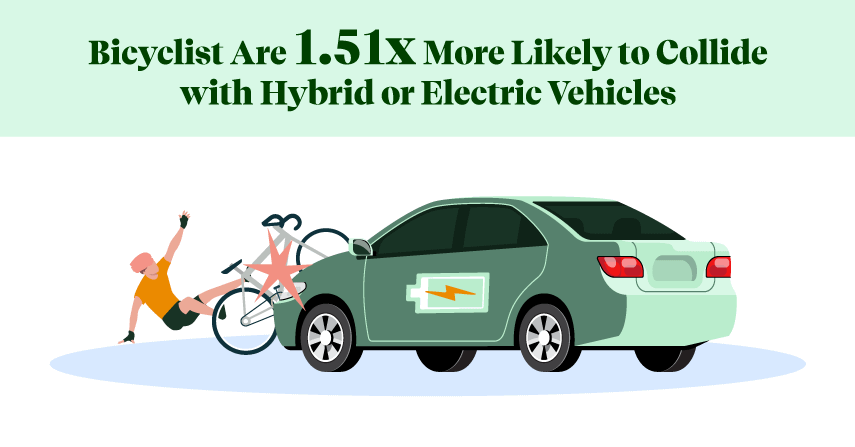
Climate change is leading to more discerning buying decisions at car dealerships. However, hybrid and electric vehicles operate far more quietly than a car with a standard internal combustion engine.
NHTSA officials suggest that these quiet operations make it 1.51 times more likely for a bicyclist to collide with these vehicles. It is easy to miss one leaving a driveway or making a turn. (6)
17. 1.2% of Non-Fatal Injuries in 2019
NEISS data is your go-to for understanding the prevalence of injuries due to falls or motor vehicle accidents. These same experts suggest that cyclists experienced 1.2% of non-fatal injuries in 2019. In numbers, this would be 328,903. (7)
18. One of the Most Dangerous Sports for Children
Children between the ages of 5 and 14 visit emergency rooms because of bicycle accidents more frequently than they do for any other sport. For this reason, there are strict helmet laws for youngsters under 18.
When buying a helmet, look for the CPSC certification label. (8)
19. 62% of Bicyclist Fatalities Indicate an Absence of Helmet Use
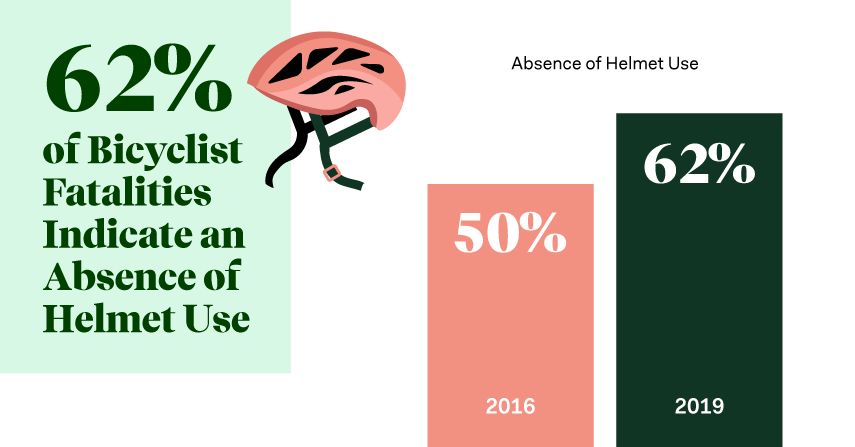
In 2016, 50% of cyclist fatalities showed that no helmet was used. This number has increased to 62% in 2019. In the absence of federal or statewide legislation mandating it for adults as well as children, the number is likely to rise. (9)
20. July is the Most Dangerous Month
Most bicyclists died in the months of July and August, which coincides with summer vacations and travel season. In contrast, the safest months were December and January. Because these are national figures, it probably indicates that inclement weather made bike-riding challenging. (9)
21. Only 21% of Men Wear Bike Helmets
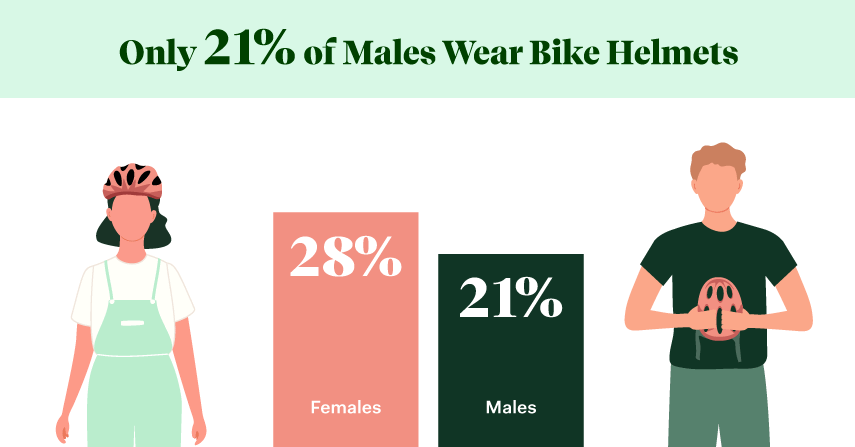
Maybe it is because the law does not mandate it, but only 21% of injured male cyclists were found to wear bicycle helmets. Females do slightly better with 28%. (10)
22. Put Your Helmet On — 51% Reduced Risk of Traumatic Brain Injuries
Physicians found that cyclists wearing helmets had a 51% reduced chance of suffering a severe traumatic brain injury and a 44% decrease in the odds of dying. Helmets also prevent many facial fractures that cyclists without headgear endured. (11)
23. $1 Billion Hospital Charges in 2013
When discussing the need for safety legislation, the National Highway Traffic Safety Administration noted that costs associated with pedal cyclist accidents resulted in $1 billion of hospital charges. Adjust for inflation and the increase in accidents, and the number is considerably higher today. (12)
24. 32% of Cyclists in Accidents Went Against Traffic
Citing an earlier study, the NHTSA noted that 32% of cyclists rode against traffic. Wrong-way driving was considered a contributor to a bicycle accident statistics crash. However, when looking at intersections, the number was 42%. (12)
25. 21% of Bike Riders Failed to Yield
Another deadly mistake of pedal cyclists is the failure to yield. It accounted for 21% of crashes. (12)
Statistics from Studies
It’s not all bad news when it comes to bike riding. Here are some other noteworthy stats to keep in mind.
26. Biking is Good for Health and Environment But Increases Traffic Injury Burden by 39%
A 2013 study in the San Francisco Bay Area found that increasing median walking and bicycling time from 4 to 24 minutes reduced the burden of cardiovascular disease and diabetes by 14% and decreased greenhouse gas emissions by 14%.
However, more bikes in movement showed an increase in traffic injuries by 39%. That means thoughtful measures on and around roadways need to be implemented in order to minimize additional injuries. (13)
27. Increasing Bicycle Safety, Subsequent Increase in Bicycle Commuting
According to numerous studies, if you increase the safety and accessibility around the bicycle transportation system you will have more people using these bike-friendly facilities.
In one study, they found that a 10% upgrade to bicycle facilities suggested a 10% or greater increase in the share of bicycle commuters. (14)
Another example: in Salt Lake City there was a 27% increase in cyclists over the course of the year following new and improved bikeways in 2011. (15)
28. Dedicated Bike Lanes Decrease Accidents by as Much as 50%
NYC saw a 40-50% decrease in injury crashes after installing protected bike lanes. (16)
An older survey conducted in 1997 found that the reported relative danger index for bicycle facilities suggests streets with dedicated bike lanes and dedicated bike pats have the lowest rates of accident frequency. (17)
29. Beyond Lung Power — Physical Activity Substantially Increases Health Benefits
Cyclists have to face the fumes and other pollutants that may be floating around in the air they ride through.
Even still, the increased physical activity seems to outweigh the inhaled air pollutants according to some studies. For instance, a 2010 study found that subjects shifting from car to bicycle use gained substantially larger health benefits. This was largely due to the increase in physical activity. (18)