21 Car Accident Statistics: United States, California, & Los Angeles
Driving a car, riding a motorcycle, or just crossing the street by foot brings with it risks. The risk of accident ranges from the minor fender bender to fatalities involving one or more traffic participants. While causes vary greatly, statistics offer us insight into the recurring problems and issues related to car accidents across the nation, the state, and even the city of Los Angeles.
United States Car Accident Statistics
1. In 2020, Drivers Logged Fewer Miles but the Number of Fatal Accidents Increased
Preliminary estimates from the National Safety Council suggest that despite quarantine restrictions, the number of deaths related to motor vehicles went up by 8% in 2020.
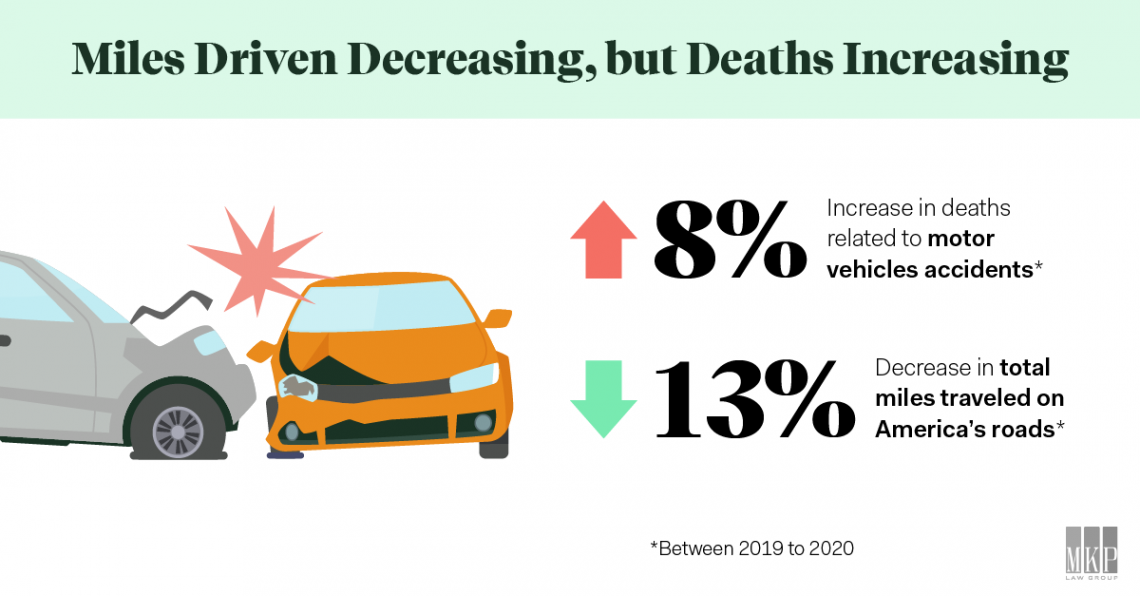
It is noteworthy that this trend developed even as the actual number of miles traveled on America’s roads decreased by 13%.
2. 20% Increase in Car Accident Property Damage Claims in 2020, Caused by Faster Driving?
Naturally, the decrease of miles traveled in 2020 begs the question: What contributed to the spike in traffic fatalities?
James Lynch of the Insurance Information Institute points the finger at faster driving. Citing data showing a 30% drop in property damage claim frequency but a 20% rise in severity, one could deduce that perhaps drivers on less-traveled roads took the open roadways as an invitation to speed.
The worst part is that as quarantines lifted and roadways started to fill up again, drivers were still speeding. This new habit, speeding, was an inevitably dangerous one.
3. Saturdays are the Deadliest Time to be on the Road
Specialists at AVVO found that Saturday is the deadliest day on US streets.
The most dangerous time? Between 4:00 p.m. and 9:59 p.m., roads are especially hazardous, regardless of the day.
4. Huge Jump in Consumer Interest of Insurance Provided Apps to Monitor Driving Behavior
Telematic apps that track driving data are not new.
What is new? Consumers want in.
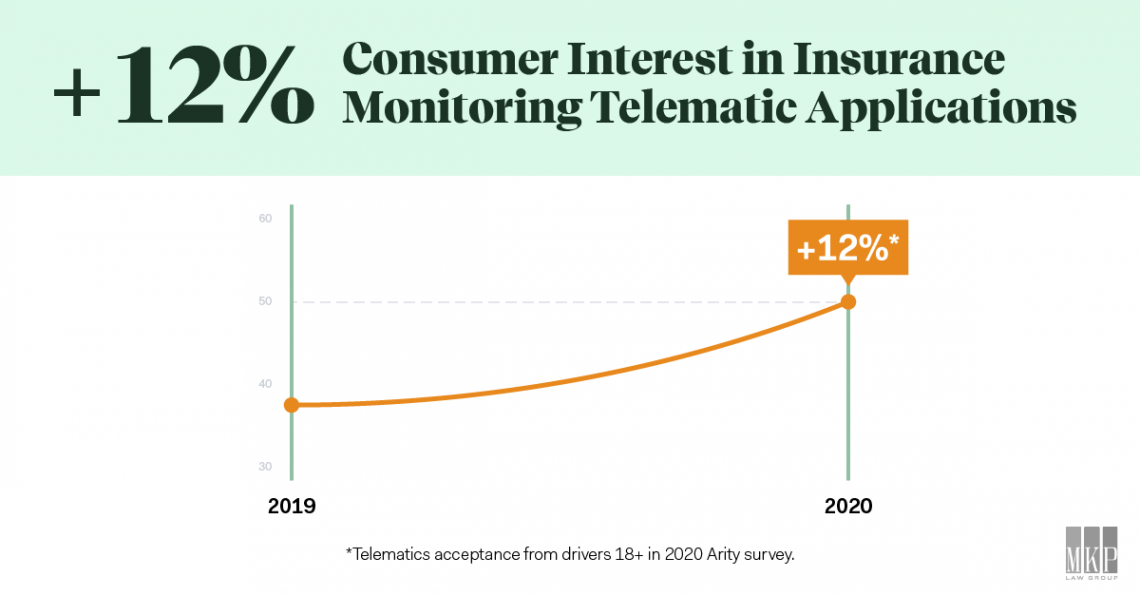
The latest survey in mid-2020 saw a total 12% jump in interest for telematics data sharing! In sum, about 50% of the survey respondents are comfortable with the idea.
Compare that to a historical annual trend of 3% increased interest each year and only 30-40% who were comfortable with the idea in 2019.
This data collection comes from Allstate-founded analytics company Arity. In the past, their surveys showed very slow growth in technology acceptance from drivers 18+. In the past, drivers feared the increases in premiums that might come if insurance companies had access to driving data. This type of telematics data includes details about driver speed, how many miles on the road, or whether they drive distracted.
Now, with generally less driving, this kind of data tracking would likely provide more insurance cost-saving opportunities for insured drivers.
5. Young Drivers Aged 16-20 Contribute Heavily to Fatal Motor Vehicle Crashes
Making up the smallest percentage of licensed drivers (5.3%), those between 16 and 20 years of age have the highest “involvement rate” of drivers in fatal crashes.
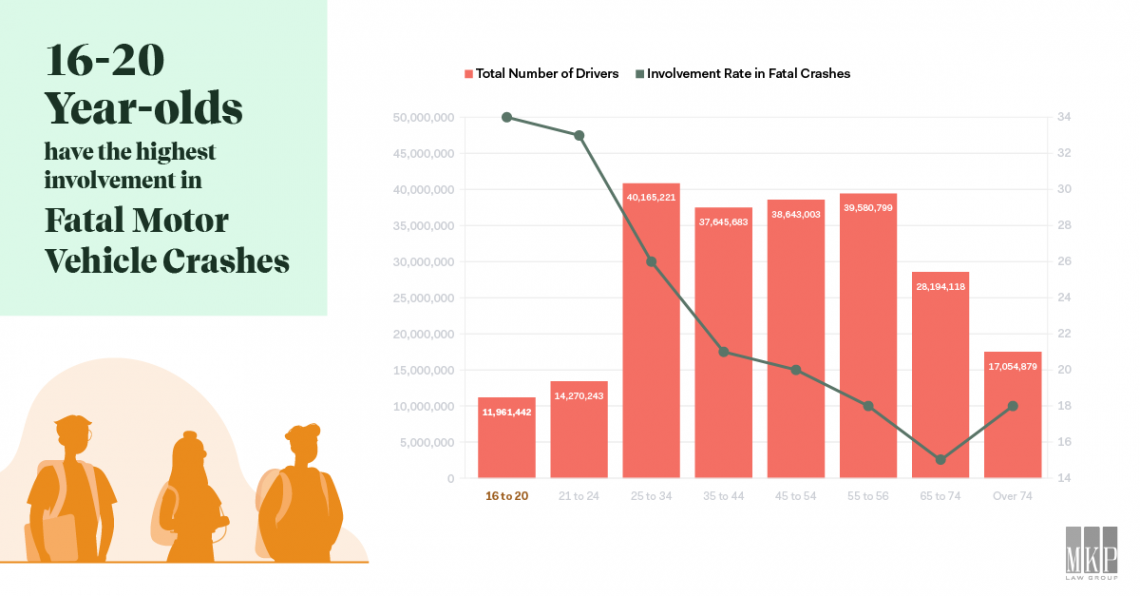
34 of every 100,000 drivers in this age group are involved in such accidents, according to the Insurance Information Institute (iii.org) highway safety data collection from 2018.
6. Distracted Driving is #5 Most Problematic Fatal Driving Behavior
There’s a reason “defensive driving” is a popular way to educate drivers. Driving behavior is a big player in car accidents, especially those that are fatal.
According to iii.org, distracted driving, which includes cellphone use, is the 5th most likely driving behavior resulting in fatal accidents, with 5.2% of all fatal crashes reporting this as a factor.
The number 1 most fatal behavior is speeding. A reported 16.7% of all deadly crashes included this behavior.
The accuracy of the reporting is somewhat worrisome, considering that 31.1% of crash reasons remain unknown.
7. Bad Weather Driving is More Deadly than Large-Scale Weather Disasters
In addition, the weather also plays a pivotal role in accidents. The Weather Channel reveals that weather-related vehicle crashes “contribute to a far higher number of deaths in the United States than large-scale weather disasters.”
The Federal Highway Administration’s Road Weather Management Program identifies wet pavement as a risk factor in 12% of crash fatalities. In contrast, icy pavement only contributes to 2% of motor vehicle deaths. This explains why some of the fairer weather states nevertheless grapple with high accident rates.
California Car Accident Statistics
8. California leads the nation with the total number of fatal crashes.
California is a populous state where road travel is an everyday necessity for the majority of the residents. This contributes heavily to the total number of accidents compared to other states. Looking closer at state-specific statistics provides us better insight into the factors surrounding car accidents in California.
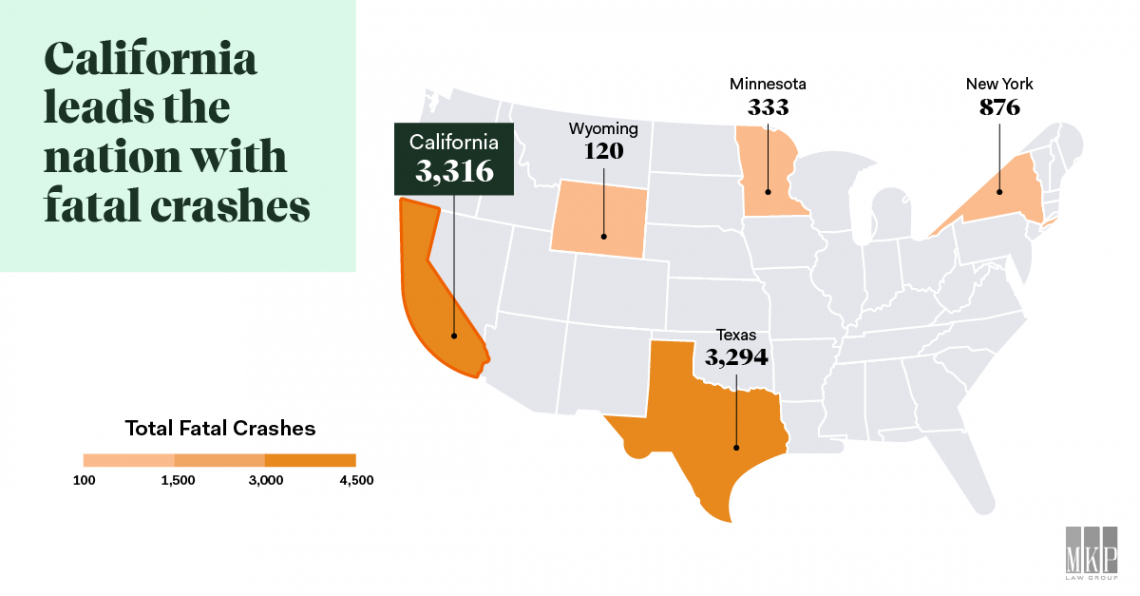
However, there exists a myriad of factors influencing state-based motor vehicle accident statistics and other data points (Insurance Institute for Highway Safety – IIHS)
For example, Mississippi has the highest total deaths per 100 million vehicles miles traveled, 1.56 (compared to California’s 1.06). At the same time, Wyoming leads the pack with 25.4 deaths per 100,000 in state-population (vs. California’s 9.1).
9. Alcohol and Age Combine for a Deadly Mix
30% of California deadly crashes include an alcohol-impaired driving component, according to the Foundation for Advancing Alcohol Responsibility. Compare this with the 28.8% national average.
Add in age, and California again goes beyond the national average.
Of the total fatalities in California, 28.8% were cases involving under-21 alcohol-impaired driving behavior. The national average: 24%.
Note: 77.9% of drivers in fatal crashes had already been caught, at least once, for impaired driving.
10. California Fatal Accidents Cost $5.83 Billion
In 2018, the total costs of traffic crash deaths totaled $5.83 Billion (CDC).
This includes a combination of medical costs and work loss costs. While you can’t really put a “price” on life, this cost is based on concrete numbers derived by analyzing the costs of claims and cases related to traffic accidents, including car accidents, motorcycle accidents, pedestrian accidents, and bicycle crashes.
Furthermore, if we look at the costs of these deaths based on age, young adults and older adults make up the majority of these losses, with 48% and 38% respectively, for a total of 86%.
11. Riding Your Bicycle is Good for the Environment, but Nonetheless Dangerous
Pedal cyclists make up 4.1% of California traffic fatalities, the NHTSA reveals.
While the state does not lead the nation – Florida comes in at 4.3% — it is nevertheless in second place. The majority of those who suffered from fatal accidents were male bicyclists.
Again, age plays a significant factor. Adults between the ages of 50 and 59 were at the highest risk of being involved in a fatal bicycle accident.
12. Lane Splitting is a Mixed Bag for California Motorcycle Riders
Lane splitting refers to the practice of riding a bike between lanes of slow-moving vehicles.
It is legal in California.
The Motorcycle Legal Foundation shows that – while safer in California – it nevertheless comes with risks. About 8% of bikers died because of striking a vehicle, which resulted in a rear-end crash. Only about 2% of fatal rear-end accidents occur when a motorcycle is struck from behind.
13. Increase in Truck-Related California Car Accidents
With more and more truck routes and delivery services, there has been a steady rise in truck-related car accident injuries and fatalities on California roads.
The California Highway Patrol put together a report showing that in 2013 there were 7,511 truck accident injuries, but by 2017 this figure rose to 9,710.
Unsafe speeds and improper turning are among the most frequently cited causes.
14. Goodbye to the Downward Trend in California Total Traffic Fatalities
While the total number of fatalities from traffic accidents is high when we look at the comparison state-to-state, there was a year-by-year downward trend in the total number of fatalities in previous years. The exact numbers aren’t exactly clear as there are differing reports from sources such as here and here. But the consensus indicates a downward trend in the past few years that was lost in 2020.
Looking specifically at California State data, since 2017, the number of fatalities shifted down:
These numbers are not consistent with a recent report from Statista, but we are looking at their March 26, 2021 data collection citing that in 2020 there was a jump up in motor-vehicle deaths to:
- 2020-3,723
15. 68% of Motor Vehicle Crash Deaths in California Occur in Urban Areas
In 2019, California vehicle crash deaths were largely located in urban areas: 68% or 2,463 fatalities. (iihs.org)
16. Which Roads are the Deadliest in California?
Security experts at A Secure Life warn that Interstate-5 has the highest death toll. In fact, it is the deadliest highway in the nation. Better known as the I-5, this popular route runs vertically from the top Northern edge of Washington State down to the bottom South of California.
Taking data from 2015-2017, the report from A Secure Life found these to be the 3 deadliest routes in the state:
- I-5: 192 fatalities
- US-101: 139 fatalities
- SR-99 110 fatalities
Los Angeles Car Accident Statistics
If the nation’s highways and byways are deadly, and the state of California leads the nation in dangerous roadways, how does Los Angeles itself stack up?
17. L.A. Drivers Spend Roughly 128 Hours Stuck in Traffic
As noted by Curbed, Los Angeles drivers wasted 128 hours stuck in traffic for the last several years.
Although transportation data tracker INRIX shows that the pandemic has decreased this loss to an estimated 45 hours, there is already an uptick in the number of vehicles that are back on the roads. As the end of COVID-19 restrictions looms large, predictions expect this number to worsen and possibly reach pre-pandemic figures.
18. Not Even COVID-19 Slowed Down Traffic Fatalities in Los Angeles
Quoting the LAPD, LAist underscores what locals already knew: Pandemics do not minimize traffic fatalities.
In the first five months of 2020, there were as many fatalities due to traffic collisions as there were during the same period the year before.
Of these deaths, 60% were pedestrians struck by drivers.
19. Road Rage is a Serious Concern for Los Angeles Drivers
With bad traffic comes frustration.
For Los Angeles drivers, this frustration expresses itself in road rage in alarming proportions. Los Angeles car accident statistics by Crosstown show a 191% increase in road rage cases from 2017 to 2020.
In 34% of the cases, the incident involved assault with a deadly weapon!
Brawling, which refers to motorists leaving their vehicles to assault one another with fists or feet, took place in about 25% of cases.
Hollywood leads the L.A. area with road rage incidents. Woodland Hills, the downtown area, and Chatsworth follow it.
20. 4th Leading Cause of Premature Death: Motor Vehicle Crashes
The Office of Health Assessment & Epidemiology of the Public Health Department outlines that traffic deaths are the fourth leading cause of premature death.
This data is of particular relevance to Los Angeles County residents between the ages of 25 and 44.
21. Los Angeles Has a Hit-and-Run Problem, and We Aren’t Talking About Baseball
Curbed outlines that Los Angeles (the city and the county) has a hit-and-run problem.
Less than 1% of drivers who flee the scene of an accident are caught and convicted of the felony.
With more than 100,000 hit-and-run accidents occurring between 2014 and 2018, 1% is barely a drop in the bucket. That means victims suffering from accident injuries are left to pay for their subsequent medical costs and other losses.