Practice Areas
25+ Important Dog Bite Statistics & Bites by Breed for 2026
We’ve done the research to bring together the most important dog bite statistics for 2026. Use this knowledge for your research on dog bite settlements and legal options.
Reviewed by Jordan W. Peagler, Esq. · Updated November 2026

Quick Answer: About 4.5 million Americans are bitten by dogs each year, and nearly 1 in 5 need medical attention, according to CDC research. Dog-bite deaths hit 127 in 2024, the most in CDC data since at least 2011, and insurance claims reached a record 28,450 in 2025. California leads the nation in claims (2,830) and USPS mail-carrier attacks (673).
We’ve done the research to bring together the most important dog bite statistics for 2026, using the newest data available from the CDC, USPS, the Insurance Information Institute and California’s own health records. Use this knowledge for your research on dog bite settlements and legal options.
If you or someone you love was hurt by a dog or in another personal injury accident, MKP Law Group, LLP can help you understand your options. Book a free case evaluation with our team.
Key Takeaways
- About 4.5 million people are bitten by dogs in the U.S. each year, and nearly 1 in 5 need medical care (CDC).
- Insurers paid $1.86 billion on 28,450 dog-related claims in 2025, a 25.6% jump in claims from 2024 (Triple-I).
- California’s average claim was $81,789 in 2025, about 25% above the national average of $65,450.
- Deaths from dog bites hit 127 in 2024, the most in CDC data since at least 2011, up from 31 in 2016 (CDC WONDER).
- California ER visits for dog bites rose for the fifth straight year in 2025, to 58,977, up 39.5% since 2018 (HCAI data).
- Lacerations and punctures make up most dog bite ER visits with a recorded injury type (Loder, 2019).
- In California, dog owners can be liable for bites even if the dog never bit anyone before, and property owners and operators may also share liability.
Bitten By a Dog? Here Are 3 Next Steps
- Get medical care and report the bite. Wash the wound, see a doctor for deep wounds or if you don’t know the dog’s rabies status, and report the bite to local animal control (CDC guidance).
- Save the evidence. Photograph the wounds and the scene, get the owner’s name and the dog’s rabies vaccination details, and keep every medical bill.
- Get an estimate, then talk to a lawyer. Try our dog bite settlement calculator, read about our Los Angeles dog bite lawyers, or book a free case evaluation.
It’s hard to consider man’s best friend might ever pose a threat to anyone you love. However, if you dig into the research of dog bite statistics, the numbers tell a complicated but clear story.
Dog bites are a serious public health concern, and understanding the facts can help victims protect themselves and their families. If you or a loved one were injured by a dog, you should know your legal rights. A qualified dog bite attorney can help you pursue compensation, and tools like a dog bite settlement calculator can provide an initial estimate of what to expect in a potential recovery.
U.S. Dog Bite Statistics at a Glance (2026)
- 4.5 million dog bites occur in the United States annually and nearly 1 in 5 (885,000) require medical attention, according to a CDC-led survey (2001–2003 data).
- Adults with two or more dogs at home are five times more likely to be bitten than adults without dogs, according to the CDC.
- Dog bite emergency care costs at least $400 million annually in the U.S., according to a 2019 study by Randall Loder in Heliyon.
- Dog-related insurance claims jumped 25.6% in 2025, from 22,658 in 2024 to a record 28,450, according to Triple-I and State Farm.
- The average dog-related insurance claim reached $65,450 in 2025, nearly double the average in 2016, despite declining 5.5% from 2024.
- Homeowners insurers paid out $1.86 billion in liability claims related to dog bites and other dog-related injuries in 2025, according to Triple-I.
- Almost 19,000 reconstructive procedures for dog bites were performed in 2022, according to the American Society of Plastic Surgeons.
- Dog-related deaths reached 127 in 2024, the highest annual total in CDC data since at least 2011, after averaging 70 annually between 2018 and 2023.
Dog bite deaths in the U.S. by year (CDC data)
| Year | Deaths from being bitten or struck by a dog |
|---|---|
| 2011 | 34 |
| 2012 | 34 |
| 2013 | 35 |
| 2014 | 36 |
| 2015 | 36 |
| 2016 | 31 |
| 2017 | 36 |
| 2018 | 35 |
| 2019 | 48 |
| 2020 | 62 |
| 2021 | 81 |
| 2022 | 98 |
| 2023 | 96 |
| 2024 | 127 |
Counts are deaths with dog bite or strike (ICD-10 code W54) as the underlying cause and exclude rabies deaths (Source: CDC WONDER).
Were you or your child bitten? You can get a free case evaluation to talk through what happened and what your options may be.
Most Common Dog Bite Injuries, According to U.S. Hospital Data
Lacerations and puncture wounds are the most common dog bite injuries treated in U.S. emergency rooms. A national study of emergency department data estimated roughly 3 million dog bite ER visits from 2005 to 2013. It is the most recent national breakdown by injury type we found. Lacerations, meaning tears or cuts, made up 31.6% of those visits, and puncture wounds made up 27.7%. Among visits where a specific injury type was recorded, about 9 in 10 were one of the two.
Most of these patients were treated and released, and 1.7% were admitted to the hospital. Newer CDC estimates for 2024 put the share hospitalized or transferred at about 4.6% (see #7 below). The study counted only ER visits. Bites treated at urgent care or a doctor’s office, and bites that were never treated, aren’t included.
Where the Bite Lands Shapes the Injury
The type of wound often depends on the part of the body that was bitten. In an analysis of leg and foot bites treated in U.S. ERs from 2005 to 2019, punctures (33.0%) were about twice as common as lacerations (16.9%). A 20-year study of head and neck bites in children found the opposite pattern: lacerations accounted for 77.5% of injuries, and punctures accounted for 10.2%.
Children are especially vulnerable to face and neck bites. National ER data shows that younger patients are much more likely to be bitten on the head and neck, while adults are more often bitten on the arms and hands. Loder, author of the National ER study, suggests one reason: a young child’s face is closer to the level of a dog’s mouth. Torn facial skin can leave visible scarring and may require surgical repair.
Some Bites Are More Serious Than They Look
A study of 26 U.S. children’s hospitals reviewed nearly 69,000 pediatric dog bite cases from 2010 to 2020. It found that 24% of the children had clinically significant injuries. In that study, 9.7% were admitted, 7.4% needed treatment in an operating room, and 5.4% were diagnosed with a skin or soft-tissue infection.
Bites can also spread germs that cause infection, even when the wound doesn’t look deep, according to the CDC. The harm isn’t only physical. Many people experience anxiety, depression or post-traumatic stress after an attack.
The most common mistake MKP sees after a bite is waiting to get care.
“The most common mistake dog bite victims make in the first week is not obtaining medical treatment. Dog bite wounds are very susceptible to infection and often require antibiotics to ensure a healthy recovery. Furthermore, documenting the injury was caused by the animal bite is important to establishing medical causation, a requirement to any successful insurance claim.” —Jordan W. Peagler, Esq., MKP Law Group, LLP
From Injury to Compensation
The type, location and severity of an injury all affect what a claim is worth. Bites that leave scars on visible areas, such as the face or forearms, generally carry more value, as Jordan W. Peagler explains in our dog bite claims statistics below. Infections, surgery and long-term care needs can add to a claim as well.
Settlements depend on more than immediate medical bills. Emotional suffering and lost income also factor in. A dog bite settlement calculator can give an early estimate, and you can compare typical dog bite settlement amounts in Los Angeles, California and nationwide. Every case is different, though, so it’s worth speaking with a personal injury lawyer about yours.
California Dog Bite Statistics: Record ER Visits and Rising Insurance Claims
California has more dog bite insurance claims and more dog attacks on mail carriers than any other state, while dog bite ER visits have reached record highs. New analysis also finds that insurance payouts have risen nearly twice as fast as the number of claims since 2023.
- 2,830 dog-related insurance claims were filed in California in 2025, more than any other state, resulting in $231.5 million in payouts, according to Triple-I and State Farm.
- 61.5% increase in California’s dog-related insurance payouts between 2023 and 2025, from $143.3 million to $231.5 million, nearly twice the 34.5% increase in claims, according to our analysis of Triple-I data.
- Dog-related insurance claims cost 25% more in California than the national average in 2025, at $81,789 per claim versus $65,450 nationwide, according to Triple-I and State Farm.
California Dog-Related Insurance Claims and Payouts, 2023–2025
| Measure | 2023 | 2025 | Change | Compared with U.S. (2025) |
| Insurance claims | 2,104 | 2,830 | +34.5% | 9.9% of U.S. claims |
| Total payouts | $143.3M | $231.5M | +61.5% | 12.4% of U.S. payouts |
| Average claim | $68,125 | $81,789 | +20.1% | 25% above U.S. average ($65,450) |
Source: Insurance Information Institute and State Farm data, analyzed by MKP Law Group, LLP. Percentages are calculated from published figures, with total payout values rounded to the nearest $100,000.
- 673 dog attacks on California mail carriers were reported in 2025, more than any other state. Los Angeles ranked #1 among U.S. cities with 70 attacks, according to USPS.
- 58,977 California ER visits for dog bites were recorded in 2025, up nearly 40% since 2018, and the highest annual total in state data going back to 2005, according to HCAI data analyzed by MKP Law Group, LLP.
- Rural counties had nearly 50% higher dog bite ER visit rates than more populous California counties in 2022, with the disparity concentrated in counties with fewer than 200,000 residents, according to California Healthline.
- 28 Californians died from dog bite-related deaths between 2018 and 2022, according to California Healthline’s analysis.
California emergency room visits for dog bites, 2018-2025
| Year | ER visits for new dog bites (not admitted) |
|---|---|
| 2018 | 42,277 |
| 2019 | 42,865 |
| 2020 | 37,561 |
| 2021 | 43,276 |
| 2022 | 48,596 |
| 2023 | 54,682 |
| 2024 | 56,941 |
| 2025 | 58,977 |
Source: California Department of Health Care Access and Information (HCAI), Hospital Emergency Department – External Cause of Injury/Morbidity Code Frequency files, compiled by MKP Law Group, LLP. Counts cover each injury’s first emergency department visit and exclude patients admitted to the hospital. They are not counts of unique patients.
California ERs See Four Times as Many Dog Bites as Cat Bites
In 2025, California emergency rooms recorded 58,977 dog bite-related visits. That’s about four times as many as the 13,833 cat bite-related visits, even while cat-bite related injuries are rising at much faster rates.
| Injury type | 2019 | 2025 | Change | % change |
| Dog bites | 42,865 | 58,977 | +16,112 | +37.6% |
| Cat bites | 7,366 | 13,833 | +6,467 | +87.8% |
| Cat scratches | 2,668 | 5,106 | +2,438 | +91.4% |
Between 2019 and 2025 cat bite reports in California ERs rose 87.8%, from 7,366 to 13,833, and cat scratch reports rose 91.4%, from 2,668 to 5,106. Dog bite reports rose 37.6% over the same period, from 42,865 to 58,977, according to California HCAI data compiled by MKP Law Group, LLP.
Despite the faster growth in cat injuries, dog bites still account for the largest increase in ER reports. California recorded 16,112 more dog bites in 2025 than in 2019, an increase greater than the total number of cat bites reported in 2025. Still, the gap is narrowing: California ERs recorded 5.8 dog bites for every cat bite in 2019, compared with 4.3 in 2025.
Methodology note: Figures are not adjusted for the number of dogs and cats in California and do not indicate which animal is riskier.
Hurt by a dog in Los Angeles, Long Beach or anywhere in Southern California? Our team offers a free case evaluation, and you won’t pay us a dime unless we win your case.
States and Cities with the Most Dog Bites (USPS Mail Carrier Data, 2025)
According to a USPS press release on May 28, 2026, California is the worst state for dog attacks on mail carriers. Postal Service employees suffered more than 5,200 dog attacks nationwide in 2025. These rankings count attacks on USPS employees only, not all dog bites.
| Rank | State | Dog bite/dog incidents on USPS employees, 2025 |
|---|---|---|
| 1 | California | 673 |
| 2 | Texas | 358 |
| 3 | Ohio | 287 |
| 4 | New York | 269 |
| 5 | Pennsylvania | 267 |
| 6 | Illinois | 260 |
| 7 | Florida | 183 |
| 8 | Missouri | 182 |
| 9 | Michigan | 174 |
| 10 | Indiana | 159 |
California’s totals partly reflect its size: 2 of the top 8 cities and 6 of the 33 listed cities are in California. California’s count dropped from 701 in 2024 to 673 in 2025, and Los Angeles dropped from 77 to 70, but both still rank first.
| City | Dog bite/dog incidents on USPS employees, 2025 | USPS rank |
|---|---|---|
| Los Angeles, CA | 70 | 1 |
| Dallas, TX | 50 | 2 |
| Denver, CO | 45 | 3 |
| Houston, TX | 44 | 4 |
| Chicago, IL | 43 | 5 |
| St. Louis, MO | 40 | 6 |
| Indianapolis, IN | 35 | 7 |
| San Diego, CA | 32 | 8 |
| San Antonio, TX | 31 | 9 |
| Cleveland, OH | 30 | 10 |
| Kansas City, MO | 30 | 10 |
| Cincinnati, OH | 29 | 11 |
| Minneapolis, MN | 29 | 11 |
| Oakland, CA | 27 | 12 |
| Phoenix, AZ | 27 | 12 |
| Columbus, OH | 26 | 13 |
| Detroit, MI | 24 | 14 |
| Louisville, KY | 23 | 15 |
| Memphis, TN | 21 | 16 |
| Oklahoma City, OK | 21 | 16 |
| Pittsburgh, PA | 21 | 16 |
| Sacramento, CA | 21 | 16 |
| Fort Worth, TX | 20 | 17 |
| Long Beach, CA | 20 | 17 |
| Milwaukee, WI | 20 | 17 |
| Philadelphia, PA | 20 | 17 |
| Portland, OR | 20 | 17 |
| Dayton, OH | 19 | 18 |
| Jacksonville, FL | 19 | 18 |
| Omaha, NE | 17 | 19 |
| Miami, FL | 16 | 20 |
| Rochester, NY | 16 | 20 |
| San Francisco, CA | 16 | 20 |
Source: USPS national release, May 28, 2026. USPS ranks tied cities equally, so 33 cities fill its top 20 rankings.
Dog Bite Fatalities by State: CDC Totals (2018-2024)
California recorded more deaths from dog bites or strikes than any other state from 2018 to 2024: 52 of the 547 deaths nationwide, according to CDC death-certificate data. Each number below is a seven-year total, not a yearly count. California’s high total largely reflects its size; adjusted for population, its death rate was roughly 20% below the national average.
| State | Deaths, 2018–2024 (total) |
| California | 52 |
| Texas | 50 |
| Florida | 47 |
| Ohio | 23 |
| Oklahoma | 22 |
| Illinois | 20 |
| Alabama | 19 |
| Arizona | 19 |
| Tennessee | 19 |
| Georgia | 17 |
| Michigan | 16 |
| New York | 15 |
| North Carolina | 15 |
| Indiana | 14 |
| South Carolina | 13 |
| Arkansas | 12 |
| Louisiana | 12 |
| Missouri | 12 |
| Kentucky | 11 |
| New Mexico | 11 |
| Virginia | 11 |
| Washington | 10 |
| All other states* | 107 |
| U.S. total | 547 |
*CDC doesn’t publish state counts under 10, so those states are combined. Source: CDC WONDER, Underlying Cause of Death, 2018–2024 (ICD-10 code W54, bitten or struck by dog), accessed October 2026.
Top 10 Dog Bite Statistics Across the Years
1. 1 in 33,899 Lifetime Odds of Dying in a Dog Attack

The lifetime odds of dying from a dog attack in the United States were 1 in 33,899 in 2024, according to the National Safety Council. You’re far more likely to die in a car accident, and, surprisingly, hornet, wasp and bee stings killed more Americans than dogs from 2018 to 2023 (497 deaths vs. 420), according to CDC WONDER data, though dogs pulled ahead in 2024, 127 deaths to 101.
2. 3rd Deadliest Animal on Earth
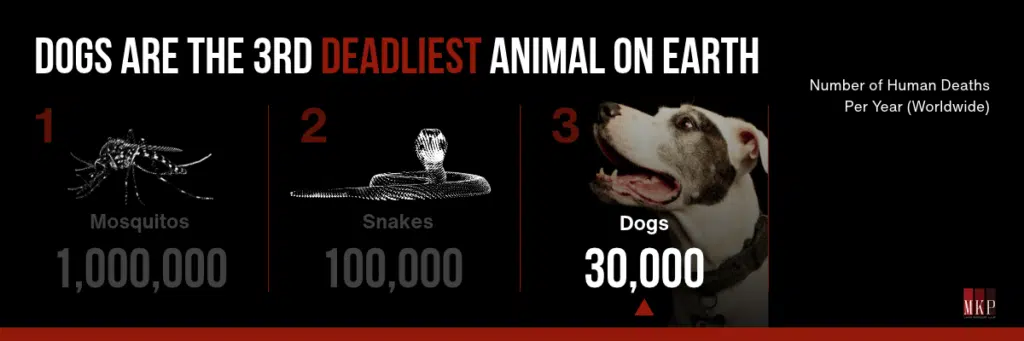
Dogs are the 3rd deadliest animal on earth. Looking at the average annual number of worldwide deaths, a Statista compilation shows dogs cause 30,000 human deaths each year, behind mosquitoes and snakes. Most of these deaths are from rabies in countries without widespread dog vaccination, not from bite injuries.
3. About 90 Million Dogs as Pets

The American Veterinary Medical Association estimates there are nearly 90 million dogs living in U.S. households, and about 68 million households own at least one dog, according to the American Pet Products Association’s 2024–2025 survey, as reported by Triple-I.
4. 4.5 Million Bitten Each Year
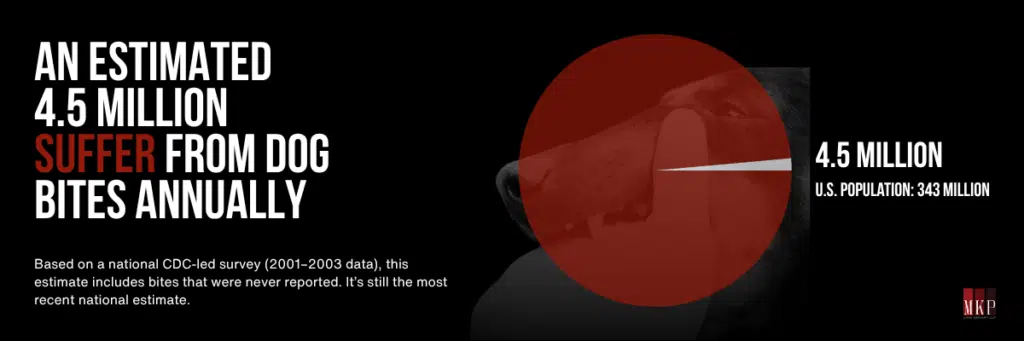
The number of individuals who suffered from dog bites annually, according to a randomized national survey conducted from 2001–2003 that estimated 4.5 million bites a year (Gilchrist et al., Injury Prevention, 2008). An earlier and still widely quoted estimate of 4.7 million came from a 1994 survey. No newer national estimate of all bites, reported or not, has been published.
5. 885,000 Dog Bite Victims Requiring Medical Attention

The number of dog bite victims from the same 2001–2003 study cited above that required medical attention. (Gilchrist et al., 2008)
6. 472,790 Emergency Room Visits in 2024
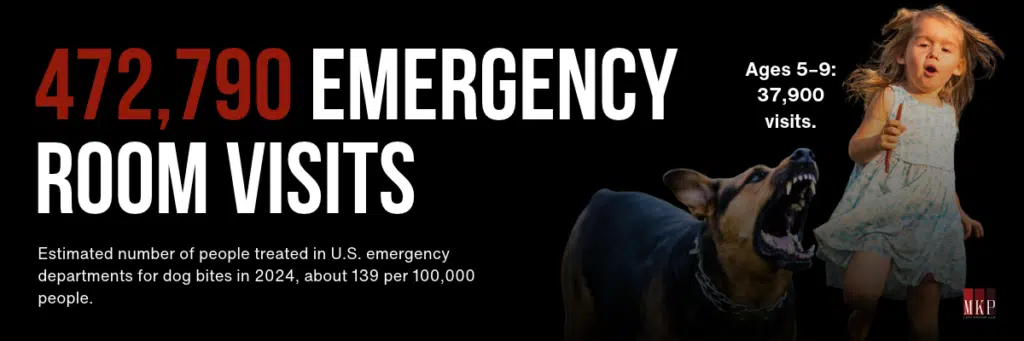
An estimated 472,790 people were treated in U.S. emergency departments for dog bites in 2024, about 139 per 100,000 people, according to CDC WISQARS (95% confidence interval: 408,527 to 537,053). Children ages 5 to 9 accounted for about 37,900 of those visits, a rate of about 188 per 100,000, roughly a third higher than the rate for all ages. Earlier studies put annual ER visits at 337,000 to 412,500 (Loder, 2019; Ramgopal and Macy, 2021).
7. 21,714 Dog Bite Patients Hospitalized After an ER Visit

In 2024, an estimated 21,714 people treated in U.S. emergency departments for dog bites were hospitalized or transferred to another hospital, about 59 a day, according to CDC WISQARS (95% confidence interval: 17,178 to 26,250). That’s about 1 in 22 (4.6%) of the 472,790 ER visits for dog bites that year.
8. 26% of Dog Bite Fatalities Were Children 0-2

The highest percent of fatal dog attacks were victims aged 0-2 years, at 26% (136 of 522) of deaths from 2005 to 2019, according to DogsBite.org’s 15-year fatality chart. DogsBite.org is a victims’ advocacy group that tracks fatal attacks through news reports.
9. About 1,300 Daily ER Visits

About 1,300 people a day were treated in U.S. emergency departments for dog bites in 2024 (472,790 visits ÷ 366 days), based on CDC WISQARS estimates. That’s up from nearly 1,000 a day in earlier national estimates covering 2005–2018 (Tuckel and Milczarski, 2020).
10. 127 U.S. Deaths in 2024, the Most in CDC Data Since at Least 2011

CDC WONDER recorded 127 deaths from dog bites or strikes in 2024, up 32% from 96 in 2023 and about four times the 2016 low of 31. From 2011 to 2018, deaths held steady at 31 to 36 a year (CDC MMWR).
Since 2018, deaths have risen every year except 2023, reaching 81 in 2021 and 98 in 2022 (CDC WONDER). Researchers link part of the increase to the surge in pet adoptions and time spent at home during and after the pandemic (Langley & Kearney, 2025).
Dog Attacks by Breed: 2026 Statistics on Bites, Attacks, and Fatalities
No government agency currently tracks dog attacks by breed, so breed statistics come from news-report tallies and single-hospital studies. They show which breeds appear most often in severe attacks, not which breeds are most likely to bite.
11. 80+ Breeds Associated with Fatal Attacks
Certain breeds appear more frequently when organizing dog bite statistics by breed, which can help inform legal claims. While breed statistics are informative, every individual dog is different, just like people, and liability always depends on the circumstances surrounding each incident, including the dog’s history, owner negligence, and the environment where the bite occurred. Fatal dog attacks are relatively rare but understandably devastating.
Each fatality underscores the importance of responsible pet ownership and reinforces why victims and their families may seek legal action after a preventable tragedy. Understanding these risks is essential for anyone handling dog bite claims or evaluating the severity of a case for a settlement.
More than 80 breeds and mixed breeds have been reported in fatal dog attacks since 2016, including German Shepherds, Huskies, Labradors, Rottweilers and pit bull-type dogs, according to Pit Bull Hero, a pit bull advocacy site. The site concludes that no single breed is uniquely responsible for fatal attacks and that most serious incidents are preventable.
Other trackers count the same deaths differently. DogsBite.org, a victims’ advocacy group that compiles fatal attacks from news reports, found that a small number of breeds appear far more often than others:
Breeds Most Often Named in Fatal Attacks (DogsBite.org, 2005–2019)
| Breed | Deaths | % of Total |
|---|---|---|
| Pit bull | 345 | 66.1% |
| Rottweiler | 52 | 10.0% |
| Mixed-breed | 26 | 5.0% |
| German Shepherd | 22 | 4.2% |
| Mastiff/Bullmastiff | 18 | 3.4% |
| American bulldog | 16 | 3.1% |
| Husky | 14 | 2.7% |
Based on 2005-2019 data from DogsBite.org, an advocacy group that compiles fatal attacks from news reports – data source. DogsBite.org’s news-based count captured 98% of the deaths CDC recorded from 2005 to 2020 (569 of 581), which is one reason its breed tallies are widely cited despite coming from an advocacy group.
A breed’s share of fatal attacks doesn’t show how likely any one dog of that breed is to bite. The American Veterinary Medical Association notes that counts like these can reflect how common a breed is in a community, gaps in how attacks get reported, and how individual dogs are kept and treated by their owners, including use in dog fighting. Owner and situation factors also come up again and again: in the National Canine Research Council’s review of 2000–2015 deaths, most involved several controllable factors at once, such as no one present to step in, a dog that wasn’t neutered, or a dog kept isolated rather than as a family pet.
What breed data can and can’t tell you
Breed counts measure how often a breed shows up in reports, not how likely an individual dog is to bite. A true bite rate would need the number of dogs of each breed, and no reliable national breed count exists.
- The CDC stopped tracking breed. The CDC’s last breed analysis covered deaths from 1979 to 1998 and found pit bull-type dogs and Rottweilers involved in more than half of them, while warning that breed reports are unreliable (Sacks et al., 2000). Death certificates in CDC WONDER don’t record breed.
- Visual breed identification is often wrong, especially for mixed-breed dogs and “pit bull-type” labels, according to the AVMA.
- Severity is a separate question. Some single-hospital dog bite studies link pit bull-type dogs to more severe injuries. For example, one pediatric head-and-neck study found pit bull bites had about five times the relative rate of surgery (O’Brien et al., 2015).
A common question when it comes to dog bites is:
Which breeds are the most dangerous?
The AVMA or American Veterinary Medical Association conducted an in-depth literature review to analyze existing studies on dog bites and serious injuries. Their findings indicate that there is no single breed that stands out as the most dangerous.
According to their review, studies indicate breed is not a dependable marker or predictor of dangerous behavior in dogs. Better and more reliable indicators include owner behavior, training, sex, neuter status, dog’s location (urban vs. rural), and even varying ownership trends over the passing of time or geographic location.
For example, they note that pit bull-type dogs are often reported in severe and fatal attacks. The American Veterinary Medical Association suggests this may relate to the breed’s popularity in a community, reporting bias, and how individual dogs are treated by their owners, such as use as fighting dogs (AVMA literature review; first published 2014).
The AVMA also opposes breed-specific legislation, meaning laws that ban or restrict particular breeds, and favors breed-neutral dangerous-dog laws, education and responsible ownership (AVMA).
Which dog breeds bite the most?
According to research published in February 2019 examining dog bite injuries to the face, dogs from 66-100 pounds with short, wide heads and significant bite force had the highest bite risk.
The study includes a review of literature from 1970 to the present day. Their research indicates that the top 6 breeds that are reported along with bite injuries are:
- “Unknown”
- Pit Bull
- Mixed Breed
- German Shepherd
- Terrier
- Rottweiler
These are based on reported biting. Often victims are less likely to report bites or attacks by smaller or medium-sized dogs because the damage isn’t as severe.
However, that doesn’t mean smaller breeds are less likely to bite.
So take care and watch out for signs of aggression regardless of the dog’s breed!
12. 75.5% of Dog Bite Fatalities Meet 4 or More of 7 Defined Criteria
According to an analysis of data from 2000-2015 by the National Canine Research Council, an animal advocacy organization, there are 7 controllable factors related to dog bite fatalities. In dog bite fatalities reported over the 15 year period, 75.5% were found to have 4 or more of the following criteria:
- No other person around to intervene → 86.9%
- The victim had no relationship with the dog → 83.7%
- The dog was not neutered or spayed → 77.9%
- The dog is kept as a resident dog rather than a family pet → 70.4%
- The compromised physical ability of victim → 68.7%
- Mismanagement of the dog → 39.3%
- Owner’s abuse or neglect of dog → 20.6%
13. 70.4% of Dog Bite Fatalities Were Not Family Pets
Along with the National Canine Research Council’s data study cited above, 70.4% of dog bite-related fatalities from 2000-2015 were not family pets.
14. 243 Bites in Indianapolis by Police Dogs Alone
A national analysis of police dog bites from 2017-2019 found that Indianapolis police dogs have a higher incidence of biting.
Of the 243 bites, IndyStar reported in 2020 that 159 were unarmed or non-violent, while 84 were likely armed and considered violent.
For comparison, there were about 28.3 bites for each 100,000 city residents in Indianapolis over 2017–2019, while in Los Angeles, there were about 5.3 police dog attacks for every 100,000 residents.
15. 5,200+ USPS Employees Attacked in 2025
Every year the USPS releases a report detailing the number of attacks reported by their letter carriers.
U.S. Postal Service employees suffered more than 5,200 dog attacks in 2025, according to USPS.
The report includes the top cities with the most attacks. First is Los Angeles, with 70 mail carrier attacks in 2025, followed by Dallas with 50 and Denver with 45.
16. 66% of Fatal Dog Bite Deaths Caused by Pit Bulls
DogsBite.org, a victims’ advocacy group, reviewed deaths caused by dogs over 15 years. From their data collection, they found 345 of 522 deaths from 2005 to 2019 were from pit bull attacks.
Rottweilers made up 10%, followed by mixed breeds, German Shepherds, Mastiffs/Bullmastiffs, American Bulldogs and Huskies.
Fatal attacks only represent a small portion of dog injuries to humans.
17. 87.6% of Pit Bulls Pass the American Temperament Test
According to the American Temperament Test Society, many of the breeds often thought of as dangerous consistently perform well in their testing. Even those considered dangerous or aggressive by most people often perform incredibly well.
The Temperament Test observes and measures temperament indicators such as stability, friendliness, protectiveness, shyness, and aggressiveness.
87.6% of the 960 American Pit Bull Terriers that tested passed the test. That’s higher than Collies (80.9% of 906 dogs) and slightly higher than German Shepherds (85.7% of 3,500) and Golden Retrievers (85.9% of 836). Across all 36,333 dogs tested, 84.0% passed.
Among breeds with at least 50 dogs tested, the lowest scoring breed is the Bearded Collie, with a 58.5% passing rate among 53 dogs tested.
ATTS cautions that its pass rates are not a measure of a breed’s aggression and are not a scientific study: owners choose whether to test their dogs, and the figures are cumulative since 1977 (data as of January 2023).
18. Dog Bites cause 26% of Animal-Related Injuries
According to data taken from a 5-year period of 6,457,534 emergency department visits caused by animal-related injuries, 26% were caused by dog bites. This study looked at data from the US population.
Dog bites were second only to bites from non-venomous arthropods (41%).
19. 50 States Prohibit Organized Dog Fighting
In all 50 US states, organized dogfighting is considered a felony, and attending a dogfight is a federal crime.
Dogfighting is a violent and very lucrative underground market. It is a sad life for a dog. Dogs are raised isolated and chained, with little socialization.
Their ears are often cropped, and tails cut off. If you suspect that someone is illegally raising dogs for dog fighting purposes, it’s important to report this type of activity.
The reality is that even though dogfighting is illegal in most countries around the world, there is still a dogfighting culture that thrives.
20. 1960: Human Rabies Deaths in the U.S. Drop Sharply
The CDC’s Morbidity and Mortality Weekly Report reviewed rabies deaths and exposures over an 81-year period: 1938-2018.
Their work uncovered that while rabies posed a great risk for the US population for many years, after 1960, this risk dramatically decreased.

Thanks to rabies vaccinations, the threat of rabies infections in humans from dogs (in the US) has all but vanished.
At present, the threat of rabies as a cause of death, particularly human death, is primarily from bats or dogs bitten abroad in countries with a high risk for rabies.
21. 20,000 to 40,000 Years of Domestic Dogs
In July 2017, Stony Brook University published a study providing insight into the origin of our modern dogs.
Their work revealed the DNA results of prehistoric dogs from Germany. The findings?
The ancestors of our modern dogs likely were gray wolves.
Scientists used the genomes of ancient European dogs, including remains about 7,000 years old.
Their work “narrowed” the exact period of domestication to somewhere between 20,000 and 40,000 years ago.
Dog Bite Claims Statistics for 2026
Homeowners insurers paid a record $1.86 billion on 28,450 dog-related claims in 2025, and the value of claims has more than tripled since 2016, according to Triple-I and State Farm.
Since there are nearly 90 million pet dogs in the US, it’s no surprise that many individuals invest in insurance coverage for their canine pets. For many, dogs are additional family members!
While insurance concerns for pet owners are often based on pet health, it’s important to consider the damage dogs might cause. Insurance companies are well aware of these types of damages. That’s because they experience great losses if homeowners they cover have a dog that bites.
While homeowners and renters insurance policies do typically cover dog bite liability, dog bite injury claims can be costly for them. So, some insurers require dog owners to sign liability waivers, charge more for certain breeds, or exclude a dog from coverage after it bites someone, according to Triple-I.
The Insurance Information Institute and State Farm released their 2025 data in 2026. Here are the big numbers to know:
22. $1.86 Billion Paid
In 2025, homeowner insurers paid out $1.86 billion to cover dog bite and dog-related injury claims, up 18.6% from 2024.
That’s a lot of money dedicated to 28,450 dog bite claims nationwide.
To put it in perspective, the value of these claims has risen 209% since 2016, when insurers paid $602 million.
23. $65,450: Average cost per claim Nationwide.
Dog bites can cause severe medical injuries and disabilities. They can also cause emotional and economic distress for the individual and the family.
Courts keep many factors in mind when determining the damages incurred. The fact is, dog bites are very traumatic events and can easily cost victims innumerable losses, including medical, physical, economic, psychological, and more.
The state with the highest average cost per claim in 2025 was New York at $92,154, followed by Connecticut ($87,751) and California ($81,789), according to Triple-I.
“Dog bite case values fluctuate largely, but some of the factors that increase the case value the most are location of the bite and whether a scar results. Bites to visible parts of the body, such as the face or forearms, generally carry more value.” — Jordan W. Peagler, Esq., MKP Law Group, LLP
24. 2,830 Claims in California in 2025
California is the US state with the highest number of dog bite claims in 2025, ahead of Florida (2,347) and Michigan (1,432).
California’s claims rose 17.1% from 2,417 in 2024, an increase of 413 claims, according to Triple-I and State Farm. That’s a slower rise than the 25.6% increase in claims nationwide.
While the Golden State may not be the place with the highest percentage of dog owners, it does have a city with more dogs than children.
According to a 2018 survey, there were an estimated 120,000 to 150,000 dogs in San Francisco and only 115,000 children (under 18).
Dog bite claims in the U.S., 2016–2025
| Year | Value of claims ($ millions) | Number of claims | Average cost per claim |
|---|---|---|---|
| 2016 | $602.2 | 18,123 | $33,230 |
| 2017 | $686.3 | 18,522 | $37,051 |
| 2018 | $674.9 | 17,297 | $39,017 |
| 2019 | $796.8 | 17,802 | $44,760 |
| 2020 | $853.7 | 16,991* | $50,245 |
| 2021 | $881.9 | 17,989 | $49,025 |
| 2022 | $1,136.0 | 17,597 | $64,555 |
| 2023 | $1,116.0 | 19,062 | $58,545 |
| 2024 | $1,569.6 | 22,658 | $69,272 |
| 2025 | $1,862.1 | 28,450 | $65,450 |
| Change, 2016–2025 | +209.2% | +57.0% | +97.0% |
*Triple-I’s current table lists 17,597 claims for 2020, the same figure it reports for 2022. We use 16,991, the count Triple-I originally reported for 2020, because it matches Triple-I’s published 2020 value ($853.7 million) and average cost per claim ($50,245), and the 4.6% year-over-year decline Triple-I describes.
Top 10 states for dog bite claims, 2025
| Rank | State | Number of claims | Average cost per claim | Value of claims ($ millions) |
|---|---|---|---|---|
| 1 | California | 2,830 | $81,789 | $231.5 |
| 2 | Florida | 2,347 | $62,375 | $146 |
| 3 | Michigan | 1,432 | $68,018 | $97 |
| 4 | Ohio | 1,348 | $41,413 | $56 |
| 5 | Pennsylvania | 1,324 | $68,786 | $91 |
| 6 | Texas | 1,313 | $70,885 | $93 |
| 7 | New York | 1,308 | $92,154 | $121 |
| 8 | Illinois | 1,283 | $79,596 | $102 |
| 9 | Indiana | 824 | $53,396 | $44 |
| 10 | New Jersey | 818 | $77,447 | $63 |
| U.S. total | 28,450 | $65,450 | $1,862.1 |
Source for both tables: Insurance Information Institute and State Farm. Includes other dog-related injuries, such as fractures or other blunt-force trauma injuries.
25. Beyond Claims: 2002 California Murder and Manslaughter Conviction
In 2001 a young woman was attacked and killed in her own San Francisco apartment hallway by her neighbors’ dogs.
The sad reality is that even within close proximity of our homes, others’ pets can pose a threat.
California prosecutors tried the dog owners, a woman, and her husband, in 2002. The wife was convicted of second-degree murder and the husband of involuntary manslaughter, according to Triple-I (CNN coverage of the trial).
Coronavirus & Dog Bites
26. Nearly 3 Times as Many Pediatric Dog Bite ER Visits During 2020 Lockdowns (Colorado)
According to a 2020 report in The Journal of Pediatrics, dog bites in children surged during and following the Coronavirus Stay-at-Home Order in Colorado. Children’s Hospital Colorado’s emergency department saw nearly three times as many dog bite visits in spring 2020 as in the same period in 2019.
Researchers linked the rise to more time at home with pets during lockdowns. Later analyses tie the post-pandemic rise in fatal dog attacks to the surge in pet adoptions and more time spent at home (Langley & Kearney, 2025).
What These Numbers Mean Under California Law
California holds dog owners strictly liable for most bites, which means a victim usually doesn’t have to prove the dog was dangerous before.
- Strict liability for bites. Under California Civil Code §3342, a dog owner is liable when the dog bites someone in a public place or someone lawfully in a private place, including the owner’s property, regardless of the dog’s past behavior or the owner’s knowledge of it. California is not a “one-bite rule” state.
- Limits. The statute protects people who are lawfully present, so trespassers generally can’t rely on it, and it has a limited exception for police and military dogs. Injuries that don’t involve a bite, like being knocked down, are usually handled under negligence rules instead.
- Others may share liability. Landlords, property managers and businesses can sometimes be responsible, depending on what they knew and controlled. See our guide to landlord liability for dog bites in California.
- Shared fault. California uses comparative fault, so a victim’s own share of blame can reduce their recovery. In a February 2026 Los Angeles verdict, jurors assigned 12.5% of the fault to the injured woman (Los Angeles Times).
- Deadlines. The deadline to file a personal injury lawsuit is generally two years under Code of Civil Procedure §335.1. Different rules can apply to minors, and claims against a city or county usually require a government claim within six months.
- Reporting. California regulations require animal bites from species that can carry rabies, including dogs, to be reported to the local health officer in declared rabies areas (17 CCR §2606). Doctors who treat bites typically file these reports.
Recent Dog Bite News (2025–2026)
- August 2026, Ventura County: Bruce, a dog declared “vicious” after several biting incidents, was euthanized by Ventura County Animal Services while an emergency appeal was pending at the U.S. Supreme Court. One victim required surgery and skin grafts after a bite to the arm (ABC News).
- May 2026, statewide: USPS ranked California first among states and Los Angeles first among cities for dog attacks on mail carriers in 2025 (USPS).
- May 2026, Sacramento: AB 2574, a bill that would require dog owners to receive a written notice of their rights when a dog is seized as potentially dangerous or vicious, was held in the Assembly Appropriations Committee and missed the deadline to advance this session. (LegiScan).
- 2026, national: Triple-I and State Farm reported a record 28,450 dog-related claims for 2025 (Triple-I).
- February 2026, Los Angeles: A Los Angeles County jury awarded $5.4 million to a woman bitten by a shelter dog with a documented bite history, finding the city 62.5% liable (Los Angeles Times).
Cases like the Bruce dog and the $5.4 million Los Angeles shelter verdict raise a common question: who is responsible when a dog with a known bite history hurts someone? Beyond the owner, liability can extend to a “harborer,” meaning someone who keeps or shelters a dog without owning it.
“Harborers of dogs can be held responsible if they are aware, or on notice, of the dog’s dangerous propensities and have the means to remove the dog from a certain location or residence. Proving notice can be difficult, and often requires investigation into administrative records produced by agencies such as Animal Control Services.”
— Jordan W. Peagler, Esq., MKP Law Group, LLP
How Can a Lawyer Help with a Dog Bite Case?
A lawyer can identify everyone who may be responsible, document the full cost of the injury and handle the insurance company, which matters because the average dog bite claim now tops $65,000.
Dog bite statistics by breed, injury severity, and prior incidents all influence legal claims and insurance settlements. Courts and insurance companies examine the specific circumstances, including the dog’s prior behavior, whether the owner took reasonable precautions, and anything else that contributed to the negligence. A skilled dog bite lawyer can guide victims in documenting their injuries, identifying liable parties, and negotiating with insurers to pursue full compensation.
MKP Law Group, LLP has taken dog bite cases to trial. Our results include a $1.005 million jury verdict in a dog bite case. Prior results do not guarantee a similar outcome.
One client described the experience this way: “My case was a complex Dog Bite case which entailed expertise in many areas. The MKP law team of Jordan & Adam worked tirelessly through our case that ended in a trial victory…” (John, Google review, May 22, 2026) Prior results do not guarantee a similar outcome.
How to Prevent Dog Bites
Dog bite prevention comes down to supervision, socialization and giving dogs space. Children should be supervised around dogs, even trusted family pets, and individuals should never approach unfamiliar dogs without permission (CDC).
While statistics help inform legal and medical responses, preventing dog bites is the most reliable way to lower bite risk. Owners must train and socialize pets properly (early socialization with people, places and other animals matters most for puppies), keep them leashed in public spaces, and address aggressive behavior promptly. The CDC also advises against keeping dogs tied up outside, since chained dogs are more likely to bite than dogs in a fenced yard.
Don’t disturb a dog that is eating, sleeping or caring for puppies, and secure your dog during mail delivery, as USPS recommends. Report a stray or dangerous dog to the local authorities to help prevent future injuries. Communities benefit when everyone supports dog bite prevention, while victims are better positioned to protect themselves and their families.
Contact a Dog Bite Lawyer if You Need Help with Your Case
Dog bite injuries can have long-lasting physical, emotional, and financial consequences. If you or a loved one has been bitten, you don’t have to deal with the legal system alone. Our team can guide you through every step of the claims process, help you use a dog bite settlement calculator for preliminary estimates, and pursue full compensation for your medical costs, lost wages, and pain and suffering.
Our attorneys exclusively represent injury victims. If you were injured by a dog or in another personal injury accident, contact MKP Law Group, LLP to book a free case evaluation, or call 323-524-9619. You won’t pay a dime in attorney fees unless we win.
Areas MKP Law Group Serves
MKP Law Group serves all of LA County and the surrounding areas. Please do not hesitate to reach out for your free consultation. We are here to help you understand your options after a dog bite.
- Los Angeles, California
- Long Beach, California
- Orange County, California
- San Bernardino, California
- Riverside, California
- Imperial County, California
- Ventura County, California
- Huntington Beach, California
- Anaheim, California
- Irvine, California
- Hemet, California
Sources and Methodology
We compiled these statistics from government agencies, peer-reviewed studies, insurance industry data and, where labeled, advocacy groups. Each figure lists its data year, which can differ from the year the report was published. Breed figures come from news-report tallies and single-hospital studies and should not be read as bite rates.
- American Society of Plastic Surgeons – Best practices to heal dog bites (2022 data, 2024)
- American Veterinary Medical Association – Dog Bite Risk and Prevention: The Role of Breed (literature review, 2014)
- American Veterinary Medical Association – Why Breed-Specific Legislation Is Not the Answer
- California Healthline (KFF) – A Record Number of Californians Are Visiting Emergency Rooms for Dog Bites (2022 data, published 2024)
- California HCAI – Hospital Emergency Department Diagnosis and External Cause Codes (2018–2025 data)
- CDC – Dogs: Healthy Pets, Healthy People (updated 2026)
- CDC MMWR – QuickStats: Deaths From Being Bitten or Struck by a Dog, 2011–2021 (2023)
- CDC MMWR – Vital Signs: Trends in Human Rabies Deaths and Exposures, 1938–2018 (2019)
- CDC WONDER – Underlying Cause of Death, ICD-10 W54 (national data 2011–2024; state data 2018–2024)
- CDC WISQARS – Nonfatal Injury Reports, dog bite, all intents (2024 data; NEISS-AIP; accessed October 26, 2026).
- Gilchrist J, et al. – Dog bites: still a problem? Injury Prevention (2001–2003 data, 2008)
- Insurance Information Institute and State Farm – Spotlight on: Dog Bite Liability (2016–2025 data, 2026)
- Langley RL, Kearney GD – Animal-Related Fatalities in the United States, 2018–2023, Environmental Health Insights (2025)
- Loder RT – The demographics of dog bites in the United States, Heliyon (2019)
- National Safety Council – Odds of Dying (2024 data)
- O’Brien DC, et al. – Dog bites of the head and neck, Am J Otolaryngol (2015)
- Ramgopal S, Macy ML – US estimates for dog bite injuries presenting to emergency departments, Public Health (2021)
- Sacks JJ, et al. – Breeds of dogs involved in fatal human attacks, 1979–1998, JAVMA (2000)
- Tuckel PS, Milczarski W – The changing epidemiology of dog bite injuries in the United States, 2005–2018, Injury Epidemiology (2020)
- USPS – Postal Service Names Top Cities and States for Dog Attacks on Mail Carriers (2025 data, May 28, 2026)
- USPS – Los Angeles Ranks #1 With the Highest Dog Attacks on Mail Carriers (2025 data, May 28, 2026)
- DogsBite.org (advocacy) – Quick Statistics (updated 2026)
- DogsBite.org (advocacy) – 15-Year U.S. Dog Bite Fatality Chart, 2005–2019
- DogsBite.org (advocacy) – 15-Year Fatality Chart by Age Group, 2005–2019
- DogsBite.org (advocacy) – Multi-Year Fatalities by State, 2005–2020 (cited for capture rate)
- National Canine Research Council (advocacy) – Dog Bite-Related Fatalities, 2000–2015
- Forrester JD, et al. – Animal encounters in the USA, Trauma Surgery & Acute Care Open (2018)
- Dixon CA, Mistry RD – Dog bites in children surge during COVID-19, The Journal of Pediatrics (2020)
- Morzycki A, Simpson A, Williams J – Dog bites in the emergency department: a descriptive analysis, CJEM (Halifax, Canada data; published online 2018)
- American Temperament Test Society – Breed statistics (data as of January 2023)
- Statista – Deadliest animals by annual number of human deaths
- IndyStar – Indianapolis police dog bites investigation (2017–2019 data, 2020)
- ScienceDaily – Stony Brook University study on dog domestication (2017)
- KQED – Are there really more dogs than children in San Francisco? (2018)
- ABC News – Bruce the dog euthanized in California (August 2026)
- Los Angeles Times – Woman bitten by dog at L.A. animal shelter wins $5.4 million verdict (February 2026)
- ASPCA – Aggression in dogs
- ASPCA – A closer look at dogfighting
- American Temperament Test Society – Test description
- AAHA – Study identifies most damaging dog bites by breed (2019)
- Essig GF, et al. – Dog bite injuries to the face: is there risk with breed ownership? Int J Pediatr Otorhinolaryngol (2019)
- BBC News – Dogfighting culture (2019)
- CNN – Dog mauling trial coverage (2002)
- Dunbar Academy – Dr. Ian Dunbar’s Dog Bite Scale
- National Institute of Mental Health – Post-traumatic stress disorder
- Pitbullhero.org (advocacy) – Dog bite statistics
- California Civil Code §3342
- 17 Cal. Code Regs. §2606
- LegiScan – California AB 2574 (2025–2026 session)
- Forrester MB – Dog Bites of the Lower Extremity Treated at Hospital Emergency Departments, Lower Extremity Review (2005–2019 data, 2022)
- Epidemiology and patterns of dog bite-related head and neck injuries: A NEISS database study, Int J Pediatr Otorhinolaryngol (2005–2024 data, 2025)
- Ramgopal S, Macy ML – Pediatric patients with dog bites presenting to US children’s hospitals, Injury Epidemiology (2010–2020 data, 2021)
Cite this page: MKP Law Group, LLP. “25+ Important Dog Bite Statistics & Bites by Breed for 2026.” Reviewed by Jordan W. Peagler, Esq. Updated November 5, 2026. https://www.mkplawgroup.com/dog-bite-statistics/
Bitten By a Dog? Use Our Dog Bite Settlement Calculator to Find An Estimate of Your Claim.

Updates Log
- 2024: First Published
- 2025: Updates throughout
- April 2026: Freshly overhauled for 2026 with new statistics
- July 2026: Light updates throughout
- August 2026: Lightly updated
- November 2026: Updated with the latest Triple-I, USPS, CDC, NSC and ASPS data, and added California statistics, California law, recent news, a dog bite injuries section, FAQs and a sources list. Corrected several figures and links. Reviewed by Jordan W. Peagler, Esq.

FAQs
What breed of dog has the highest bite rate?

No one can calculate a reliable bite rate by breed, because there is no national count of how many dogs of each breed exist. By raw counts, pit bull-type dogs appear most often in fatal-attack tallies kept by the advocacy group DogsBite.org and in some emergency department studies. The AVMA says breed alone is a poor predictor of whether a dog will bite.
What are the most common dog bite injuries?
Lacerations (tears or cuts) and puncture wounds. In national ER data from 2005 to 2013, lacerations made up 31.6% of dog bite visits and punctures 27.7%. Injury type also depends on location: leg bites are more often punctures, while face and neck bites in children are mostly lacerations.
How many dog bites are there per year in the USA?
There are roughly 4.5 million dog bites per year in the U.S., based on a CDC-led national survey (2001–2003 data). Nearly 1 in 5 people bitten need medical care, and the CDC estimates 472,790 people were treated in U.S. emergency rooms for dog bites in 2024.
What is the likelihood of a dog biting you?
Roughly 1.5% per year, or about 1 in 64 people, based on an estimated 4.5 million bites a year and a U.S. population of about 290 million at the time of the survey (2001–2003 data). No newer national estimate of all bites exists.
What percentage of dog bites are from pit bulls?
There’s no national system in the U.S. that tracks all bites by breed. One peer-reviewed study of 475 adult dog bites treated in emergency departments in Halifax, Canada, found pit bull-type dogs were the most frequently implicated breed, at 27% (Morzycki et al., CJEM). Results from one region may not reflect bites elsewhere.
What breed of dog is most likely to bite its owner?
A breed-specific answer isn’t supported by strong evidence. The AVMA notes serious bites often involve a familiar dog (family, friend, or neighbor), so relationship/context tends to matter more than breed.
Which state has the largest number of dog bites?
No source counts every dog bite by state, but California leads on the two measures that are tracked. USPS data show California had the most dog attacks on postal workers (673 in 2025), and Triple-I data show California had the most dog bite insurance claims (2,830 in 2025).
What does a level 4 dog bite look like?
Using the Dunbar Bite Scale, Level 4 is typically 1-4 punctures from a single bite with at least one puncture deeper than half the length of the dog’s canine tooth, often with significant bruising and/or tearing from holding on/shaking.
What does the AVMA say about dog bites and breed?
The American Veterinary Medical Association says breed is a poor sole predictor of dog bites and that controlled studies don’t single out pit bull-type dogs. It points instead to factors like neuter status, socialization, supervision and how a dog is kept. The AVMA opposes breed-specific legislation.
Did the CDC stop tracking dog bites by breed?
Yes. The CDC’s last breed study covered fatal attacks from 1979 to 1998 and was published in 2000, and its authors cautioned that breed reports are unreliable. CDC death data still counts dog-related deaths but doesn’t record breed.
How many people die from dog attacks each year?
An average of 70 Americans a year died from being bitten or struck by a dog from 2018 to 2023, according to CDC WONDER data. That’s double the average of about 35 a year from 2011 to 2017. CDC WONDER recorded 127 deaths in 2024, the most of any year since at least 2011.
What is the average cost that dog bite victims have to spend for their medical treatment?
There is no single national figure, but emergency room care for dog bites costs at least $400 million a year in the U.S., according to a 2019 study. Insurance data give a sense of scale: the average dog-related homeowners claim was $65,450 nationally and $81,789 in California in 2025, covering medical bills and other damages.
Is there a one-bite rule for dog bites in California?
No. California Civil Code §3342 makes dog owners strictly liable for bites in public places or where the victim was lawfully on private property, even if the dog never bit anyone before. Other rules can apply to injuries that aren’t bites.
Do dog bites have to be reported in California?
Generally, yes. State regulations require bites from animals that can carry rabies, including dogs, to be reported to the local health officer in declared rabies areas, and the CDC recommends reporting bites to animal control. Doctors who treat a bite usually file the report.
What is the average settlement for a dog bite in California?
There is no official average settlement, because most settlements are private. The closest public benchmark is insurance data: California’s average dog-related homeowners claim was $81,789 in 2025. See our dog bite settlement amounts page or use our settlement calculator for a rough estimate.
How does my attorney get paid?
Our attorneys at MKP are paid on what is known as a contingency fee, meaning we only get paid if we recover money for you. The attorneys at MKP Law Group don’t charge attorney fees unless and until they win your case. If we win your case, we receive a specific percentage of the gross amount we win for you. MKP also offers free consultations to see if we’re the right fit for your case.